
- Title
-
Biosynthetic deficiency of docosahexaenoic acid causes nonalcoholic fatty liver disease and ferroptosis-mediated hepatocyte injury
- Authors
- Li, X., Liu, C., Zhang, R., Li, Y., Ye, D., Wang, H., He, M., Sun, Y.
- Source
- Full text @ J. Biol. Chem.
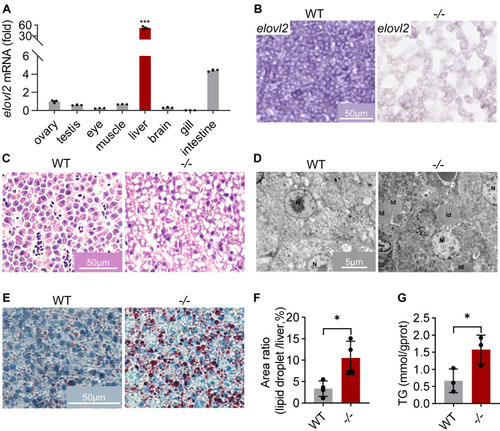
Deficiency of elovl2 led to NAFLD of zebrafish. A, qRT-PCR analysis of elovl2 in different tissues. B, in situ hybridization of elovl2 on sections of WT and −/− livers. Scale bar: 50 μm. C, HE (hematoxylin-eosin) staining of WT and −/− liver sections. Scale bar: 50 μm. D, TEM (transmission electron microscopy) analysis of WT and −/− liver sections. Scale bar: 5 μm. E, Oil-Red staining of WT and −/− liver sections. Scale bar: 50 μm. F, quantitative analysis of Oil-Red staining signals. G, triglyceride (TG) content in WT and −/− livers. All values are mean ± SD. A Student t test was used. ∗p < 0.05, ∗∗p < 0.01, ∗∗∗p < 0.001. Individual p values are listed in Table S3 . −/−, elovl2−/−; WT, wildtype. |
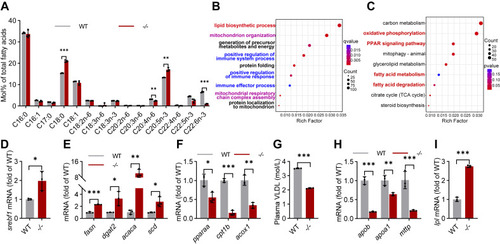
Transcription changes of lipid metabolism in the elovl2−/− liver. A, fatty acid composition in WT and −/− livers. B, GO (Gene Ontology) pathway enrichment analysis. C, KEGG (Kyoto Encyclopedia of Genes and Genomes) pathway enrichment analysis. D, qRT-PCR analysis of srebf1 in WT and −/− livers. N = 3 replicates. E, qRT-PCR analysis of genes involved in lipogenesis and lipid oxidation in WT and −/− livers. N = 3 replicates. F, qRT-PCR analysis of the genes involved in very low-density lipoprotein (VLDL) synthesis in WT and −/− livers. N = 3 replicates. G, VLDL contents in the plasma of WT and −/−. H, qRT-PCR analysis of genes involved in VLDL synthesis in WT and −/− livers. N = 3 replicates. I, qRT-PCR analysis of lpl in WT and −/− livers. N = 3 replicates. All values are mean ± SD. A Student t test was used. ∗p < 0.05, ∗∗p < 0.01, ∗∗∗p < 0.001. Individual p values are listed in Table S4 . −/−, elovl2−/−; WT, wildtype. |
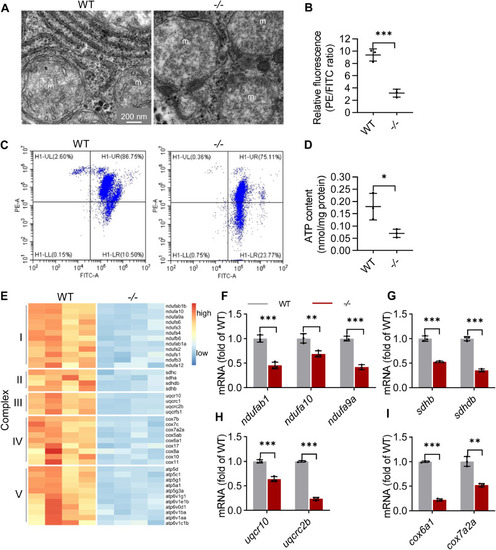
The function of mitochondria was impaired in the elovl2−/− hepatocyte. A, mitochondria ultrastructure in the hepatocytes of WT and −/−. m: mitochondria. Scale bar: 200 nm. B and C, flow cytometric analysis of mitochondrial transmembrane potential after staining with JC-1 and statistical analysis of the PE/FITC fluorescence ratios. D, analysis of ATP production in WT and −/− livers. E, heatmap of genes related with multiheteromeric enzyme complexes of oxidative phosphorylation in WT and −/− livers. F–I, qRT-PCR analysis of genes related with multiheteromeric enzyme complexes of oxidative phosphorylation in WT and −/− livers. N = 3 replicates. All values are mean ± SD. A Student t test was used. ∗p < 0.05, ∗∗p < 0.01, ∗∗∗p < 0.001. Individual p values are listed in Table S5 . −/−, elovl2−/−; WT, wildtype. |
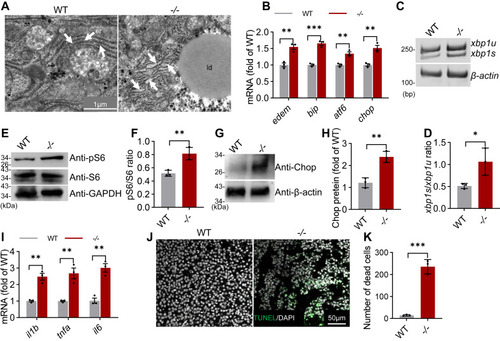
The elovl2−/− livers display endoplasmic reticulum stress and hepatocyte death. A, endoplasmic reticulum ultrastructure in the hepatocytes of WT and −/−. er: endoplasmic reticulum, white arrow indicated; ld: lipid droplet. Scale bar: 1 μm. B, qRT-PCR analysis of genes involved in ER stress in WT and −/− livers. N = 3 replicates. C and D, PCR analysis of xbp1 splicing in WT and −/− livers. Spliced xbp1 (xbp1s) mRNA to unspliced xbp1 (xbp1u) mRNA. N = 3 replicates. E and F, Western blot analysis of S6 and phosphorylated S6 proteins in WT and −/− livers. GAPDH was used as an internal control protein. Western blot bands were quantified by gray value analysis using ImageJ software. N = 3 replicates. G and H, Western blot analysis of Chop protein in WT and −/− livers. β-actin was used as an internal control protein. Western blot bands were quantified by gray value analysis using ImageJ software. N = 3 replicates. I, qRT-PCR analysis of genes involved in inflammation in WT and −/− livers. N = 3 replicates. J and K, TUNEL (TdT-mediated dUTP Nick-End Labeling) assays of WT and −/− liver sections. All values are mean ± SD. A Student t test was used. ∗p < 0.05, ∗∗p < 0.01, ∗∗∗p < 0.001. Individual p values are listed in Table S6 . −/−, elovl2−/−; WT, wildtype. |
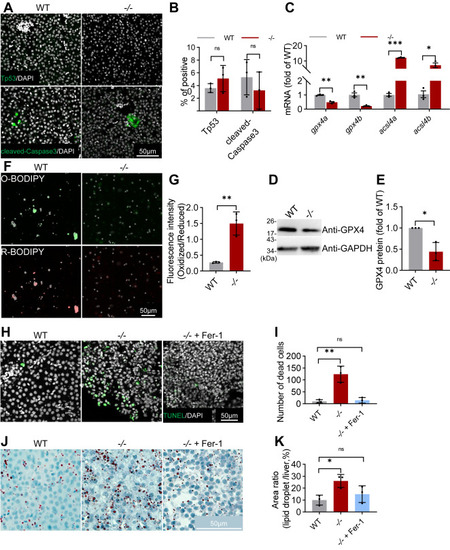
Ferroptosis contributes to hepatic injury and progression of NAFLD in elovl2 mutant. A and B, immunofluorescence of Tp53 and cleaved-Caspase3 in WT and −/− liver sections, analysis using ImageJ software. Scale bar: 50 μm. C, qRT-PCR analysis of gpx4a, gpx4b, acsl4a, acsl4b in WT and −/− livers. N = 3 replicates. D and E, Western blot analysis of Gpx4 protein in WT and −/− livers. GAPDH was used as an internal control protein. Western blot bands were quantified by gray value analysis using ImageJ software. F and G, BODIPY 581/591 C11 probe was stained in WT and −/− livers, and the fluorescence intensity ratio (Oxidized/Reduced) was calculated. H and I, TUNEL (TdT-mediated dUTP Nick-End Labeling) assays of WT, −/− and −/− + Fer-1 (ferrostatin-1) liver sections. Scale bar: 50 μm. J and K, Oil-Red staining of WT, −/− and −/− + Fer-1 liver sections, and quantitative analysis of Oil-Red staining signals. Scale bar: 50 μm. All values are mean ± SD. A Student t test was used. ∗p < 0.05, ∗∗p < 0.01, ∗∗∗p < 0.001. Individual p values are listed in Table S7 . −/−, elovl2−/−; −/− + Fer-1, elovl2−/− + Fer-1; WT, wildtype. |
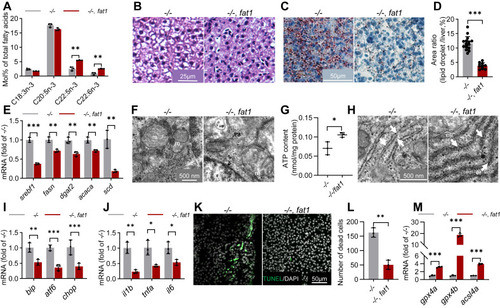
NAFLD in elovl2 mutant were rescued by fat1-transgenesis. A, fatty acid composition in −/− and −/−, fat1 livers. B, HE (hematoxylin-eosin) staining of −/− and −/−, fat1 liver sections. Scale bar: 25 μm. C and D, Oil-Red staining of −/− and −/−, fat1 liver sections, and quantitative analysis of Oil-Red staining signals. Scale bar: 50 μm. E, qRT-PCR analysis of genes involved in lipogenesis in −/− and −/−, fat1 livers. N = 3 replicates. F, analysis of mitochondria ultrastructure in the hepatocytes of −/− and −/−, fat1 liver sections. m: mitochondria. Scale bar: 500 nm. G, analysis of ATP production in −/− and −/−, fat1 livers. H, analysis of ER (endoplasmic reticulum) ultrastructure in the hepatocytes of −/− and −/−, fat1 liver sections. er: white arrow indicated. scale bar: 500 nm. I, qRT-PCR analysis of genes involved in ER stress in −/− and −/−, fat1 livers. N = 3 replicates. J, qRT-PCR analysis of genes involved in inflammation in the liver of −/− and −/−, fat1 livers. N = 3 replicates. K and L, TUNEL (TdT-mediated dUTP Nick-End Labeling) assays in −/− and −/−, fat1 liver sections. Scale bar: 50 μm. M, qRT-PCR analysis of gpx4a, gpx4b, acsl4a, acsl4b in the liver of −/− and −/−, fat1 livers. N = 3 replicates. All values are mean ± SD. A Student t test was used. ∗p < 0.05, ∗∗p < 0.01, ∗∗∗p < 0.001. Individual p values are listed in Table S8 . −/−, elovl2−/−; fat1, elovl2−/−/fat1. |
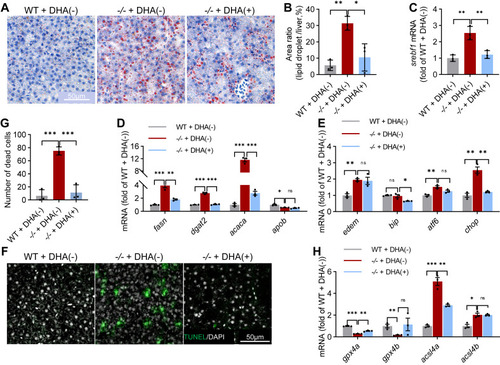
NAFLD in elovl2 mutant were rescued by feeding with a DHA-rich diet. A, Oil-Red staining of WT + DHA (−), −/− + DHA(−), and −/− + DHA(+) liver sections. B, quantitative analysis of Oil-Red staining signals. Scale bar: 50 μm. C, qRT-PCR analysis of srebf1 in WT + DHA(−), −/− + DHA(−), and −/− + DHA(+) livers. N = 3 replicates. D, qRT-PCR analysis of genes involved in lipogenesis in WT + DHA(−), −/− + DHA(−), and −/− + DHA(+) livers. N = 3 replicates. E, qRT-PCR analysis of genes involved in ER (endoplasmic reticulum) stress in WT + DHA(−), −/− + DHA(−), and −/− + DHA(+) livers. N = 3 replicates. F and G, TUNEL (TdT-mediated dUTP Nick-End Labeling) assays in WT + DHA(−), −/− + DHA(−), and −/− + DHA(+) liver sections. Scale bar: 50 μm. H, qRT-PCR analysis of gpx4a, gpx4b, acsl4a, acsl4b in WT + DHA(−), −/− + DHA(−), and −/− + DHA(+) livers. N = 3 replicates. All values are mean ± SD. A Student t test was used. ∗p < 0.05, ∗∗p < 0.01, ∗∗∗p < 0.001. Individual p values are listed in Table S9 . −/−, elovl2−/−; DHA(+), DHA-rich diet; DHA(−), DHA-deficient diet; WT, wildtype. |
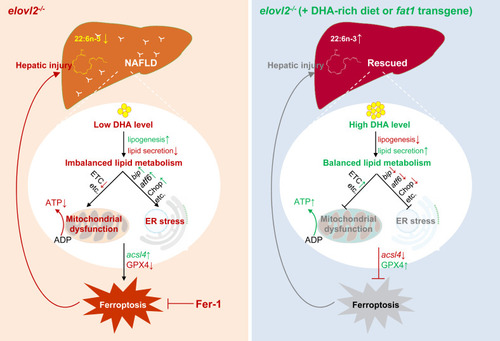
. A graphic summary of endogenously synthesized DHA in preventing nonalcoholic fatty liver disease and hepatocyte injury. In elovl2−/− mutant liver, endogenous deficiency of DHA leads to imbalanced fatty acid metabolism due to increased lipogenesis and decreased lipid secretion, mitochondrial dysfunction, ER stress, and finally ferroptosis-induced hepatic injury. Whereas, by introducing a fat1-transgene or feeding a DHA-rich diet in elovl2−/− mutant, endogenous DHA level is recovered, which leads to balanced lipid metabolism, relieved mitochondrial dysfunction and ER stress, decreased ferroptosis, and relieved hepatic injury. Red phrases or arrows indicate suppression or downregulation, and green phrases or arrows indicate activation or upregulation. |