
|
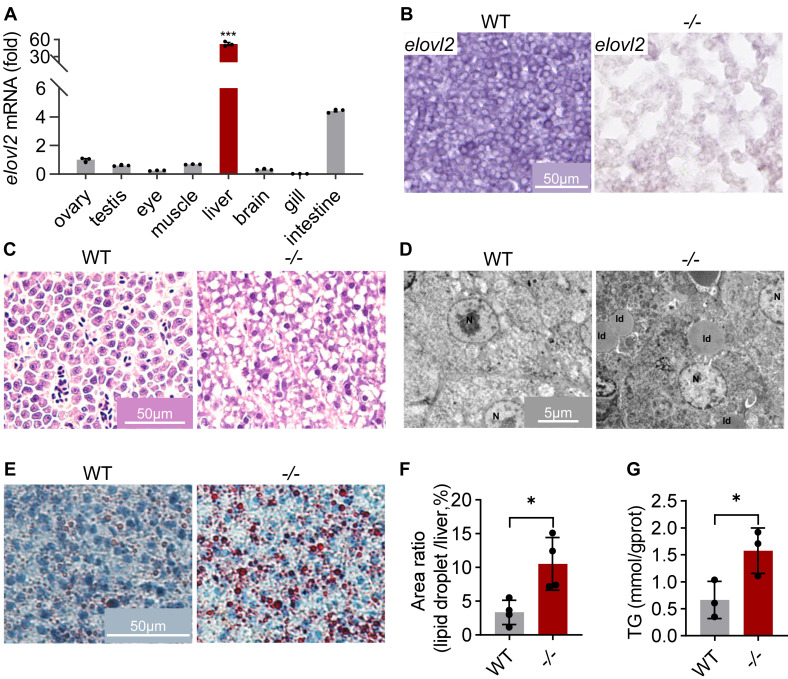
Fig. 1 Deficiency of elovl2 led to NAFLD of zebrafish. A, qRT-PCR analysis of elovl2 in different tissues. B, in situ hybridization of elovl2 on sections of WT and −/− livers. Scale bar: 50 μm. C, HE (hematoxylin-eosin) staining of WT and −/− liver sections. Scale bar: 50 μm. D, TEM (transmission electron microscopy) analysis of WT and −/− liver sections. Scale bar: 5 μm. E, Oil-Red staining of WT and −/− liver sections. Scale bar: 50 μm. F, quantitative analysis of Oil-Red staining signals. G, triglyceride (TG) content in WT and −/− livers. All values are mean ± SD. A Student t test was used. ∗p < 0.05, ∗∗p < 0.01, ∗∗∗p < 0.001. Individual p values are listed in Table S3 . −/−, elovl2−/−; WT, wildtype.