
|
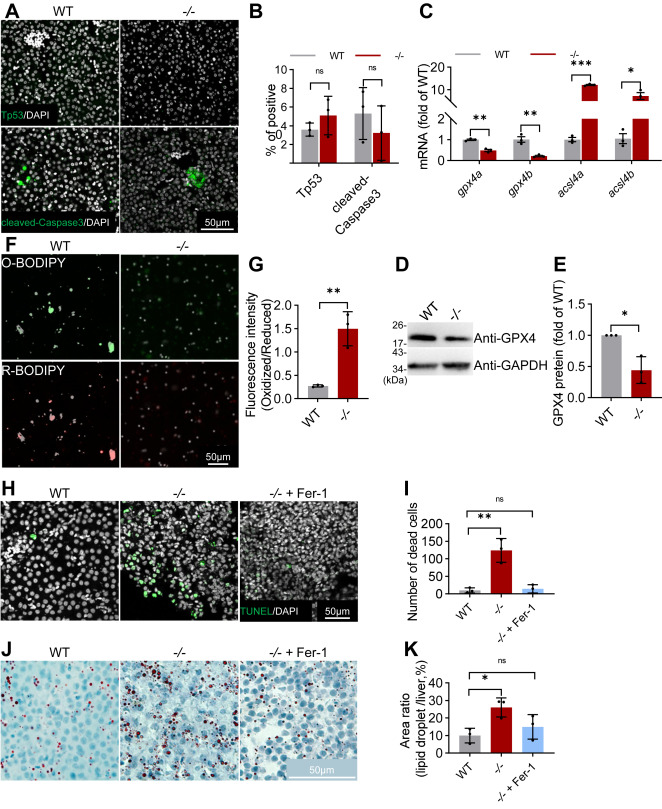
Fig. 5 Ferroptosis contributes to hepatic injury and progression of NAFLD in elovl2 mutant. A and B, immunofluorescence of Tp53 and cleaved-Caspase3 in WT and −/− liver sections, analysis using ImageJ software. Scale bar: 50 μm. C, qRT-PCR analysis of gpx4a, gpx4b, acsl4a, acsl4b in WT and −/− livers. N = 3 replicates. D and E, Western blot analysis of Gpx4 protein in WT and −/− livers. GAPDH was used as an internal control protein. Western blot bands were quantified by gray value analysis using ImageJ software. F and G, BODIPY 581/591 C11 probe was stained in WT and −/− livers, and the fluorescence intensity ratio (Oxidized/Reduced) was calculated. H and I, TUNEL (TdT-mediated dUTP Nick-End Labeling) assays of WT, −/− and −/− + Fer-1 (ferrostatin-1) liver sections. Scale bar: 50 μm. J and K, Oil-Red staining of WT, −/− and −/− + Fer-1 liver sections, and quantitative analysis of Oil-Red staining signals. Scale bar: 50 μm. All values are mean ± SD. A Student t test was used. ∗p < 0.05, ∗∗p < 0.01, ∗∗∗p < 0.001. Individual p values are listed in Table S7 . −/−, elovl2−/−; −/− + Fer-1, elovl2−/− + Fer-1; WT, wildtype.