
|
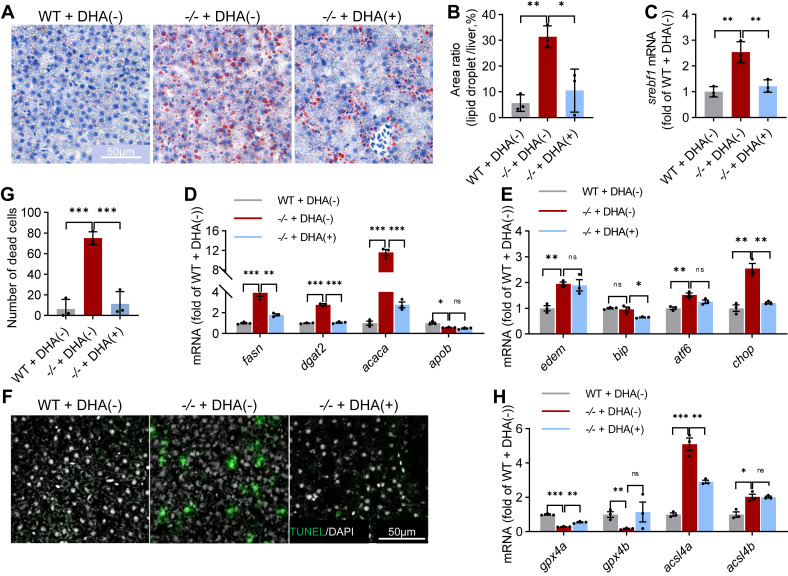
Fig. 7 NAFLD in elovl2 mutant were rescued by feeding with a DHA-rich diet. A, Oil-Red staining of WT + DHA (−), −/− + DHA(−), and −/− + DHA(+) liver sections. B, quantitative analysis of Oil-Red staining signals. Scale bar: 50 μm. C, qRT-PCR analysis of srebf1 in WT + DHA(−), −/− + DHA(−), and −/− + DHA(+) livers. N = 3 replicates. D, qRT-PCR analysis of genes involved in lipogenesis in WT + DHA(−), −/− + DHA(−), and −/− + DHA(+) livers. N = 3 replicates. E, qRT-PCR analysis of genes involved in ER (endoplasmic reticulum) stress in WT + DHA(−), −/− + DHA(−), and −/− + DHA(+) livers. N = 3 replicates. F and G, TUNEL (TdT-mediated dUTP Nick-End Labeling) assays in WT + DHA(−), −/− + DHA(−), and −/− + DHA(+) liver sections. Scale bar: 50 μm. H, qRT-PCR analysis of gpx4a, gpx4b, acsl4a, acsl4b in WT + DHA(−), −/− + DHA(−), and −/− + DHA(+) livers. N = 3 replicates. All values are mean ± SD. A Student t test was used. ∗p < 0.05, ∗∗p < 0.01, ∗∗∗p < 0.001. Individual p values are listed in Table S9 . −/−, elovl2−/−; DHA(+), DHA-rich diet; DHA(−), DHA-deficient diet; WT, wildtype.