
|
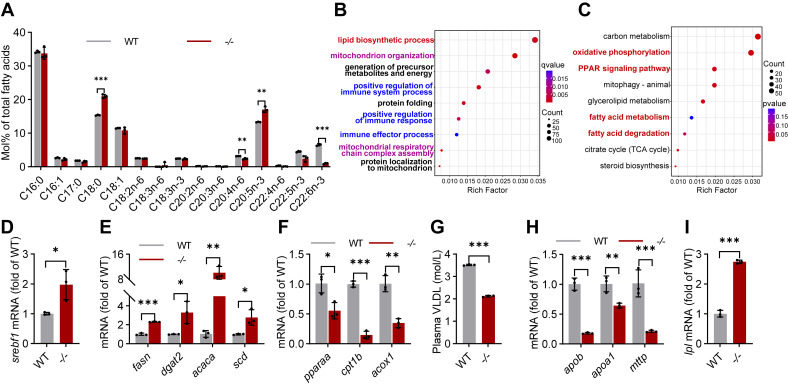
Fig. 2 Transcription changes of lipid metabolism in the elovl2−/− liver. A, fatty acid composition in WT and −/− livers. B, GO (Gene Ontology) pathway enrichment analysis. C, KEGG (Kyoto Encyclopedia of Genes and Genomes) pathway enrichment analysis. D, qRT-PCR analysis of srebf1 in WT and −/− livers. N = 3 replicates. E, qRT-PCR analysis of genes involved in lipogenesis and lipid oxidation in WT and −/− livers. N = 3 replicates. F, qRT-PCR analysis of the genes involved in very low-density lipoprotein (VLDL) synthesis in WT and −/− livers. N = 3 replicates. G, VLDL contents in the plasma of WT and −/−. H, qRT-PCR analysis of genes involved in VLDL synthesis in WT and −/− livers. N = 3 replicates. I, qRT-PCR analysis of lpl in WT and −/− livers. N = 3 replicates. All values are mean ± SD. A Student t test was used. ∗p < 0.05, ∗∗p < 0.01, ∗∗∗p < 0.001. Individual p values are listed in Table S4 . −/−, elovl2−/−; WT, wildtype.