
- Title
-
Zebrafish polg2 knock-out recapitulates human POLG-disorders; implications for drug treatment
- Authors
- Brañas Casas, R., Zuppardo, A., Risato, G., Dinarello, A., Celeghin, R., Fontana, C., Grelloni, E., Gilea, A.I., Viscomi, C., Rasola, A., Dalla Valle, L., Lodi, T., Baruffini, E., Facchinello, N., Argenton, F., Tiso, N.
- Source
- Full text @ Cell Death Dis.
EXPRESSION / LABELING:
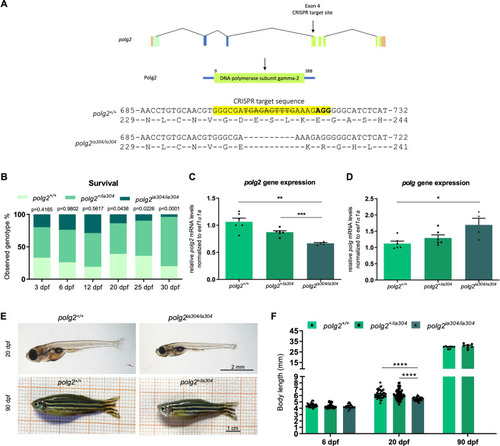
PHENOTYPE:
|
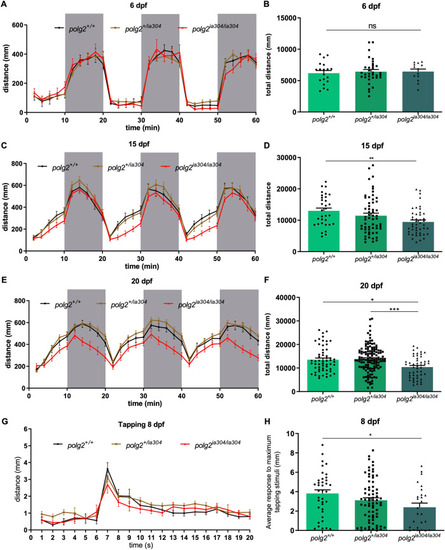
PHENOTYPE:
|
Effects of PHENOTYPE:
|
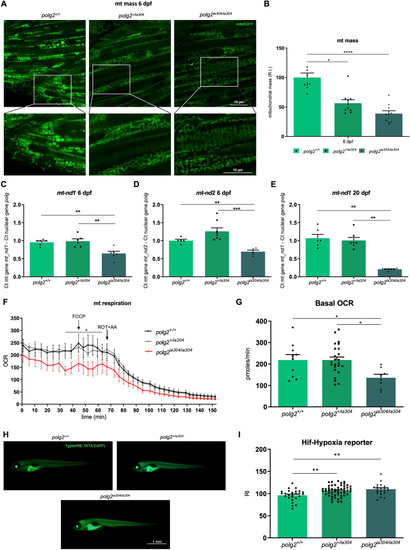
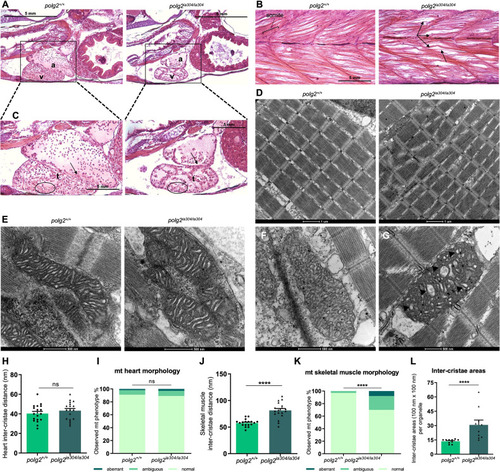
Defects in mitochondrial content, morphology and metabolism under PHENOTYPE:
|
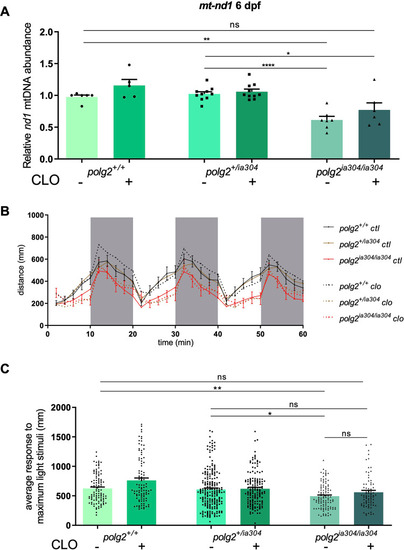
Analysis of CLO rescuing effects under PHENOTYPE:
|