|
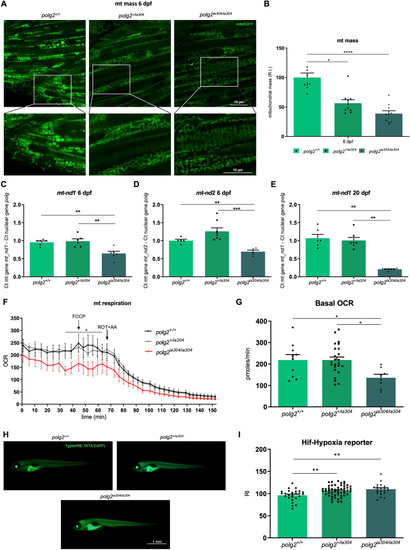
Defects in mitochondrial content, morphology and metabolism under polg2 KO. A Confocal images of the Tg(Hsa.Cox8a:MLS-EGFP)ia301 mitochondrial marker (mito:EGFP) in polg2+/+, polg2+/ia304 and polg2ia304/ia304 zebrafish at 6 dpf. Scale bar: 10 µm. B Relative quantification of the mito:EGFP transgene at 6 dpf. Data are reported as mean ± SEM. Statistics were assessed using the Kruskal-Wallis test followed by Dunn’s multiple comparison test; *p < 0.05; ****p < 0.0001; n = 10 independent larvae per condition. Comparison of relative abundances of the mitochondrial nd1 (C) and nd2 (D) genes in wt (polg2+/+), heterozygous (polg2+/ia304) and homozygous (polg2ia304/ia304) zebrafish at 6 dpf. Values are shown as mean ± SEM. Ordinary one-way ANOVA (C) or Games-Howell’s multiple comparison test (D) were applied for statistics; **p < 0.005; ***p < 0.001; Cpolg2+/+ (n = 6 × 10-larva pools), polg2+/ia304 (n = 6 × 10-larva pools), polg2ia304/ia304 (n = 6 × 10-larva pools); (D) polg2+/+ (n = 5 × 10-larva pools), polg2+/ia304 (n = 8 × 10-larva pools), polg2ia304/ia304 (n = 5 × 10-larva pools) from 3 independent biological replicates. E Analysis of the nd1 gene at 20 dpf. Values are reported as mean ± SEM. For statistical analysis, the Kruskal-Wallis test corrected with Dunn’s multiple comparison test was used; **p < 0.005; polg2+/+ (n = 6), polg2+/ia304 (n = 7), polg2ia304/ia304 (n = 7) from 3 independent experiments. F Diagram depicting the oxygen consumption rate (OCR) profile by Seahorse assay in 4 dpf wt (polg2+/+), heterozygous (polg2+/ia304) and homozygous (polg2ia304/ia304) larvae under basal conditions, FCCP (carbonyl cyanide-p-trifluoromethoxyphenylhydrazone)-induced maximal respiratory capacity stimulation and ROT/AA (Rotenone/Antimycin A)-mediated inhibition. Two-way ANOVA followed by Tukey’s multiple comparison test was applied for statistical significance; *p < 0.05 between polg2+/+ and polg2ia304/ia304 individuals. G Quantification of basal OCR in 4 dpf zebrafish. Data are shown as mean ± SEM and were analysed by ordinary one-way ANOVA; *p < 0.05; polg2+/+ (n = 9), polg2+/ia304 (n = 24), polg2ia304/ia304 (n = 8) from 3 independent replicates. H Imaging of HRE:EGFP (Hif-hypoxia) reporter at 6 dpf: an example of wt (above, left), heterozygous (above, right) and homozygous (below) mutant larva. Scale bar: 1 mm. I Integrated density analysis of Hif-hypoxia signalling activation in 6-dpf wt (polg2+/+), heterozygous (polg2+/ia304) and homozygous (polg2ia304/ia304) larvae. Values are expressed as mean ± SEM and analysed by ordinary one-way ANOVA; **p < 0.005; polg2+/+ (n = 6), polg2+/ia304 (n = 26), polg2+/ia304 (n = 52), polg2ia304/ia304 (n = 21), coming from 3 independent experiments.
|