|
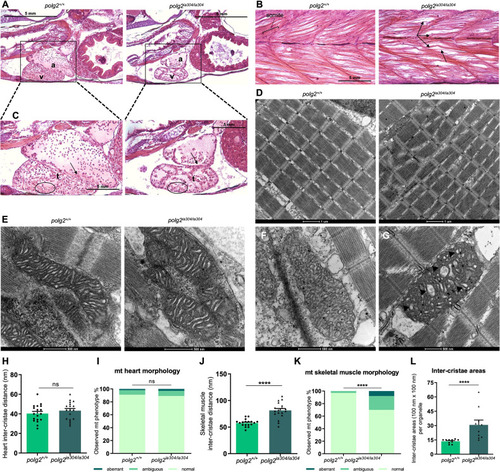
Effects of polg2 mutation on high energy demanding tissues. A, C Comparison of cardiac tissues at 20 dpf, reporting differences in atrial (a) and ventricular (v) dimensions and an altered trabecular network (t) in mutants. Scale bar: 5 mm. B Histological sections of polg2+/+ and polg2ia304/ia304 skeletal muscle tissue at 20 dpf, displaying disorganized fibres and altered somite boundaries in mutants. Arrows: detachment of skeletal muscle fibres. Scale bar: 5 mm. D TEM analysis of 20 dpf skeletal muscle of wt (polg2+/+) and homozygous mutants (polg2ia304/ia304), the latter displaying altered organization of myofibrils. Scale bar: 1 µm. E TEM analysis of mitochondria in 20 dpf heart of wt (polg2+/+) and homozygous mutants (polg2ia304/ia304). Scale bar: 500 nm. TEM analysis of 20 dpf skeletal muscle from wt (polg2+/+) (F) and homozygous mutants (polg2ia304/ia304) (G) confirms altered morphology of myofibrils and mitochondrial cristae (black arrowheads) in mutants. Scale bar: 500 nm. H Quantification of inter-cristae distance (in nm) in the cardiac region. Data are shown as mean ± SEM and statistics were done using unpaired Student’s t-test. I Quantification of heart mitochondrial (mt) aberrant morphologies. For statistical analysis, the χ2 test was applied; N = 8 independent TEM images per condition, in triplicate. J Quantification of inter-cristae distance (in nm) in the skeletal muscle. Values are reported as mean ± SEM. Statistics were assessed using unpaired Student’s t-test; ****p < 0.0001. K Quantification of skeletal muscle mt aberrant morphologies. χ2 test was used for statistical analysis, N = 8 independent TEM images per condition, in triplicate. ****p < 0.0001. L Number of wide inter-cristae areas, considered when at least equal to 100 × 100 nm, counted for each organelle in the skeletal muscle. Data are shown as mean ± SEM. Mann-Whitney test was used for statistics; ****p < 0.0001.
|