
- Title
-
A Mettl16/m6A/mybl2b/Igf2bp1 axis ensures cell cycle progression of embryonic hematopoietic stem and progenitor cells
- Authors
- Han, Y., Sun, K., Yu, S., Qin, Y., Zhang, Z., Luo, J., Hu, H., Dai, L., Cui, M., Jiang, C., Liu, F., Huang, Y., Gao, P., Chen, X., Xin, T., Ren, X., Wu, X., Song, J., Wang, Q., Tang, Z., Chen, J., Zhang, H., Zhang, X., Liu, M., Luo, D.
- Source
- Full text @ EMBO J.
( |
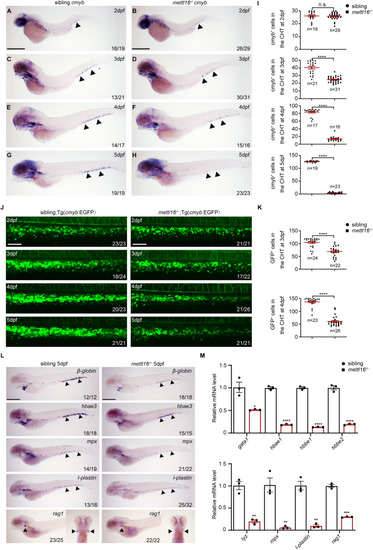
HSPC deficiency initiates in the CHT of ( |
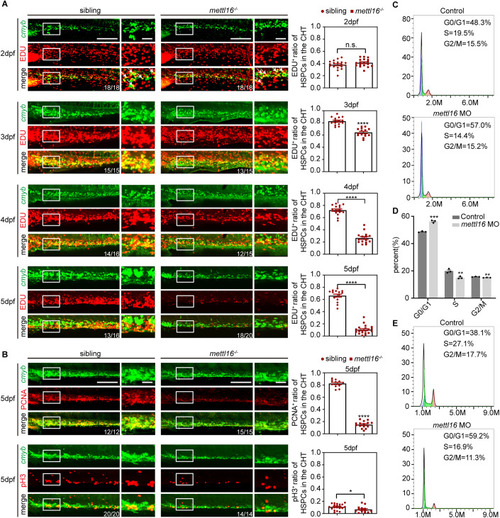
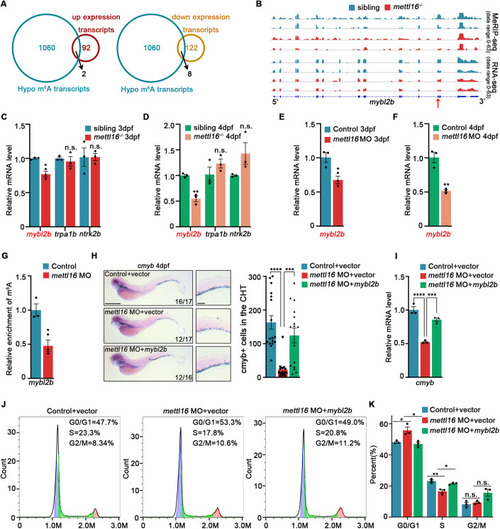
Depletion of Mettl16 inhibits HSPC proliferation through G1/S cell cycle arrest. ( |
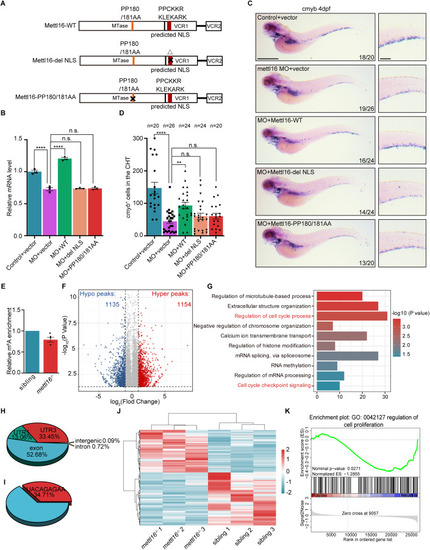
Disruption of Mettl16 invokes the alteration of m6A in cell cycle genes. ( |
( |
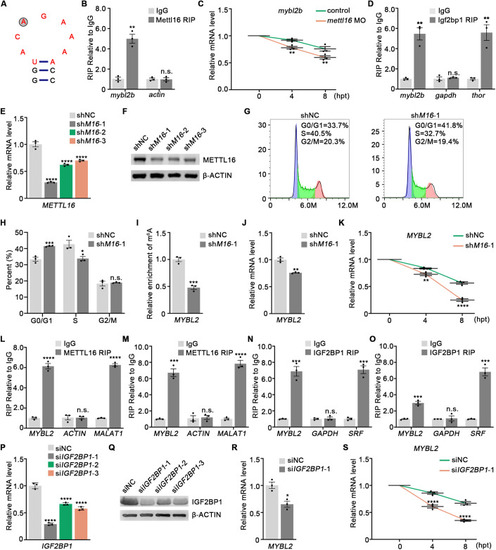
Mettl16 regulates mRNA stability of ( |