IMAGE

Figure 2

ID
ZDB-IMAGE-240520-6
Source
Figures for Han et al., 2024
Image
Figure Caption

Figure 2 
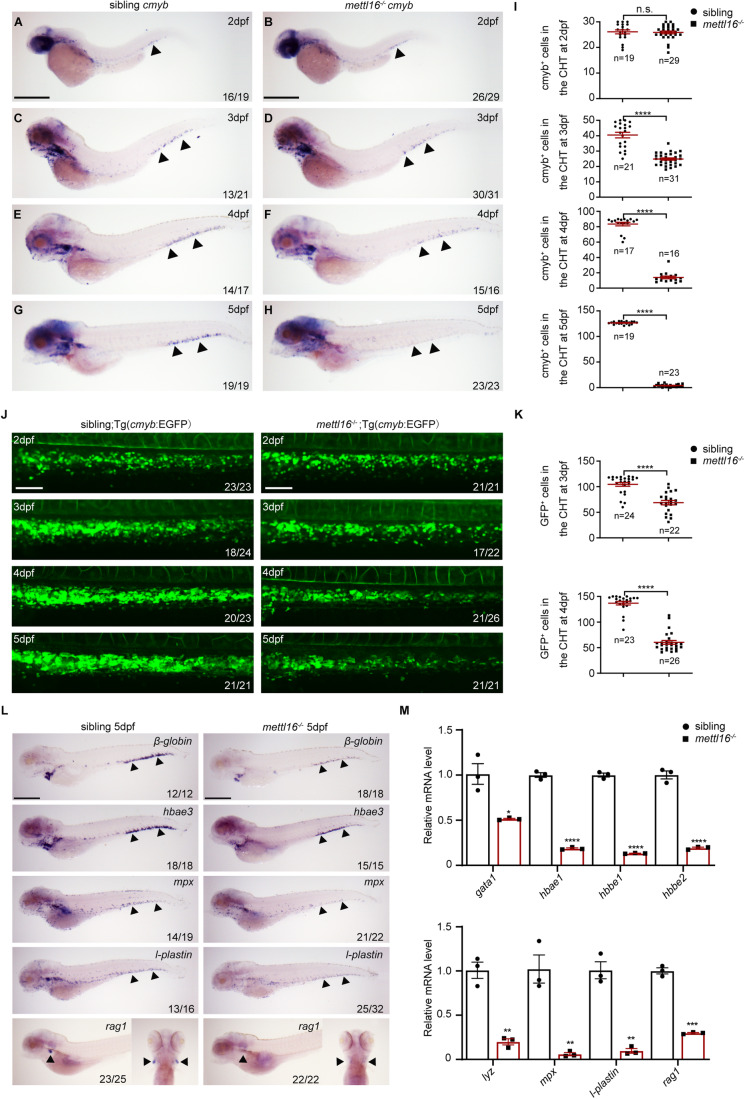
HSPC deficiency initiates in the CHT of mettl16−/− embryos.

(AH) The whole-mount in situ hybridization (WISH) assay shows the expression of HSPC marker cmyb in the CHT of siblings and mettl16 mutants from 2 to 5 dpf. Numbers at the bottom right indicate the number of embryos with similar staining patterns among all embryos examined. n = 3 independent experiments. The black arrowheads indicate cmyb+ cells in the CHT. Scale bars, 100 μm. (I) Quantification of WISH in (AH). ‘n’ indicates the number of individuals analyzed for cmyb+ cells in the CHT of siblings and mettl16 mutants, respectively, from 2 to 5 dpf. (J) Live imaging showing the number of EGFP-positive HSPCs in the CHT region of siblings/Tg (cmyb: EGFP) and mettl16−/−/Tg (cmyb: EGFP) zebrafish from 2 to 5 dpf. Numbers at the bottom right indicate the number of embryos with similar staining patterns among all embryos examined. n = 3 independent experiments. Scale bars, 20 μm. (K) Quantification of live imaging in (J). ‘n’ indicates the number of individuals analyzed for GFP+ cells in the CHT of siblings and mettl16 mutants at 3 and 4 dpf, respectively. (L) Expression of differentiation markers β-globin (erythroid), hbae3 (erythroid), mpx (myeloid), l-plastin (myeloid), and rag1 (lymphoid) in sibling and mettl16/− embryos at 5 dpf by WISH. Numbers at the bottom right indicate the number of embryos with similar staining patterns among all embryos examined. n = 3 independent experiments. The black arrowheads indicate differentiated blood cells. Scale bars, 100 μm. (M) qPCR analysis showing the expression of erythroid cell markers (upper) and myeloid cell markers (lower) in mettl16 mutants at 5 dpf. n ≥ 15 per group, performed with three biological replicates. Data information: In (I,K,M), data were represented as mean ± SEM. *adjusted P < 0.05, **adjusted P < 0.01, ***adjusted P < 0.001, **** adjusted P < 0.0001, n.s. non-significant, Student’s t-test. Source data are available online for this figure.

Acknowledgments
This image is the copyrighted work of the attributed author or publisher, and ZFIN has permission only to display this image to its users. Additional permissions should be obtained from the applicable author or publisher of the image. Full text @ EMBO J.