|
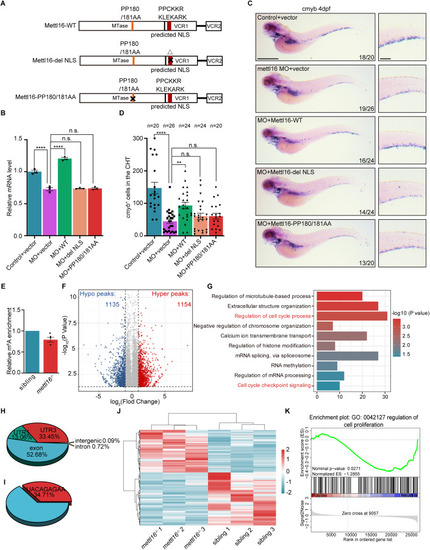
Disruption of Mettl16 invokes the alteration of m6A in cell cycle genes. (A) Schematic of Mettl16-WT and two Mettl16 mutants, including exclusive cytoplasmic Mettl16 (del-NLS) and catalytic-dead Mettl16 (PP180/181AA). (B, C) qPCR (B) and WISH (C) analysis showing the decreased expression of HSPC marker cmyb in mettl16-deficient zebrafish at 4 dpf was restored by Mettl16-WT, but not Mettl16-del-NLS and Mettl16-PP180/181AA. n ≥ 10 per group, performed with three biological replicates (B). Numbers at the bottom right indicate the number of embryos with similar staining patterns among all embryos examined, n = 3 independent experiments (C). Scale bars, 100 μm (C). (D) Quantification of WISH in (C). ‘n’ indicates the number of individuals analyzed for cmyb+ cells in the CHT at 4 dpf, respectively. (E) m6A enrichment in RNAs in the CHT of siblings and mettl16-deficient zebrafish at 3 dpf. The m6A/A level of siblings was set to one. n ≥ 20 per group, performed with three biological replicates. (F) Volcano plots reveal the differential m6A peaks of total RNAs in mettl16−/− mutants compared with siblings at 3 dpf. The significantly increased and decreased m6A peaks are highlighted in red and blue, respectively (P ≤ 0.05, |log2FC | ≥1). Statistical analysis was performed by a hypergeometric test. (G) Gene ontology analysis of the m6A peaks that decrease upon mettl16 knockout. Statistical analysis was performed by a hypergeometric test. (H) Pie chart depicting the annotations of the m6A peaks that decrease upon mettl16 knockout. (I) Pie chart depicting the percent of the significantly decreased m6A peaks which have a UACAGAGAA highly similar motif upon mettl16 knockout. (J) Heatmap showing differentially expressed genes in mettl16−/− mutants compared with siblings at 3 dpf. (K) GSEA plot showing the general downregulation of genes involved in the regulation of cell proliferation in mettl16−/− mutants compared with siblings. Statistical analysis was performed by permutation test using GSEA software. Data information: In (B, D, E), data were represented as mean ± SEM, *adjusted P < 0.05, ** adjusted P < 0.01, **** adjusted P < 0.0001, n.s. non-significant, one-way ANOVA analysis with post hoc test of Tukey’s multiple comparison correction (B, D), Student’s t-test (E). Source data are available online for this figure.
|