|
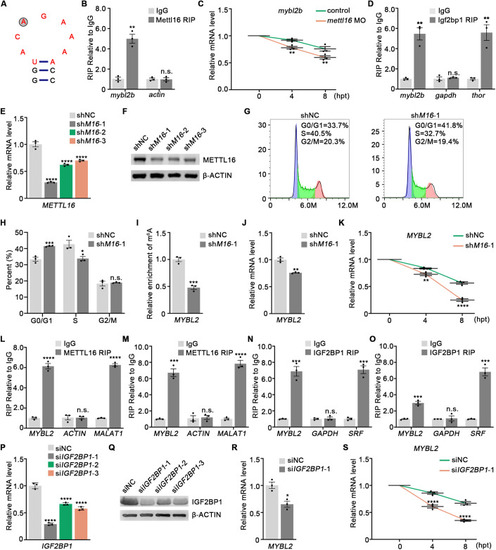
Mettl16 regulates mRNA stability of mybl2b through m6A reader protein Igf2bp1 (A) Predicted secondary structures surrounding m6A peak in mybl2b mRNA. The UACAGAAAAA box was shown in red and the m6A modification site was shown in gray circle. (B) Native RIP of Mettl16 with mybl2b mRNA in wild-type zebrafish. n ≥ 200 per group, performed with three biological replicates. actin served as negative control. (C) qPCR analysis of embryos treated with actinomycin D for 4 and 8 h showed accelerated mybl2b mRNA degradation in mettl16 morphants compared to control. n ≥ 20 per group, performed with three biological replicates. (D) Native RIP of Igf2bp1 with mybl2b mRNA in wild-type zebrafish. n ≥ 200 per group, performed with three biological replicates. gapdh and thor were served as negative and positive control, respectively. (E, F) Validation of the knockdown (KD) efficiency of the shRNAs against METTL16 by qPCR (E) and western blot (F). n = 3 biological replicates. (G, H) Flow analysis showing increased G0/G1 phase in METTL16 knockdown K562 cells. n = 3 biological replicates. (I) m6A enrichment in MYBL2 mRNA in METTL16 knockdown K562 cells by meRIP-qPCR. n = 3 biological replicates. (J) qPCR analysis showing the mRNA expression level of MYBL2 in METTL16 knockdown K562 cells. n = 3 biological replicates. (K) qPCR analysis of K562 cells treated with actinomycin D for 4 and 8 h showing accelerated MYBL2 mRNA degradation in METTL16 knockdown K562 cells. n = 3 biological replicates. (L, M) Native RIP of METTL16 with MYBL2 mRNA in K562 (L) and HEK293 cells (M). n = 3 biological replicates. ACTIN and MALAT1 were served as negative and positive control, respectively. (N, O) Native RIP of IGF2BP1 with MYBL2 mRNA in K562 (N) and HEK293 cells (O). n = 3 biological replicates. GAPDH and SRF were served as negative and positive control, respectively. (P, Q) Validation of the knockdown (KD) efficiency of the siRNAs against IGF2BP1 via qPCR (P) and western blot (Q). n = 3 biological replicates. (R) qPCR analysis showing the mRNA expression level of MYBL2 in IGF2BP1 knockdown HEK293 cells. n = 3 biological replicates. (S) qPCR analysis of HEK293 cells treated with actinomycin D for 4 and 8 h showing accelerated MYBL2 mRNA degradation in IGF2BP1 knockdown HEK293 cells. n = 3 biological replicates. Data information: In (B–E, H–P, R, S), data were represented as mean ± SEM, *adjusted P < 0.05, ** adjusted P < 0.01, *** adjusted P < 0.001, **** adjusted P < 0.0001, n.s. non-significant, Student’s t-test (B, D, H–J, L, M, N, O, R), two-way ANOVA analysis with post hoc test of Tukey’s multiple comparison correction (C, K, S), one-way ANOVA analysis with post hoc test of Tukey’s multiple comparison correction (E, P). Source data are available online for this figure.
|