IMAGE

Figure 3

ID
ZDB-IMAGE-240520-7
Source
Figures for Han et al., 2024
Image
Figure Caption

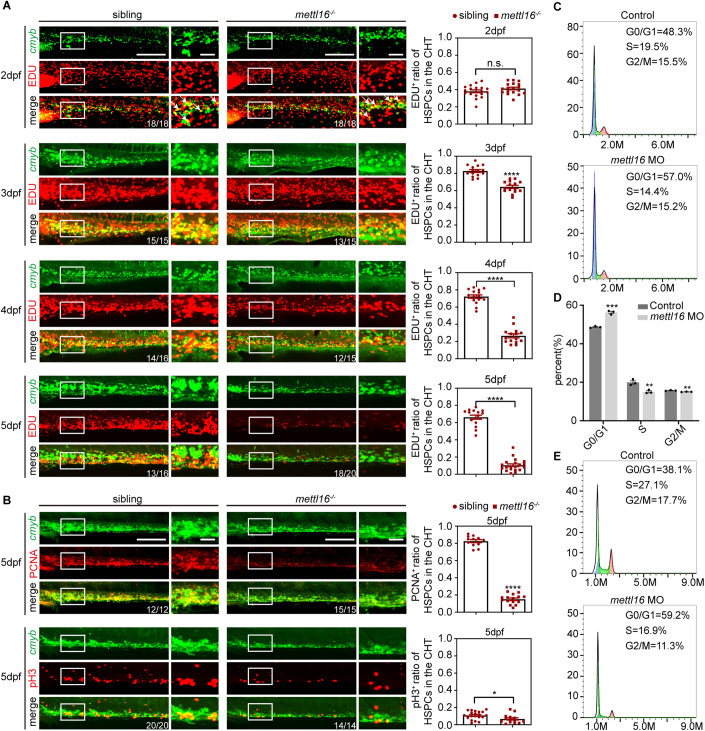
Figure 3 Depletion of Mettl16 inhibits HSPC proliferation through G1/S cell cycle arrest.

(A) Double immunostaining of cmyb: EGFP and EDU showing the number of proliferating HSPCs in the CHT of siblings and mettl16 mutants from 2 dpf to 5 dpf. Numbers at the bottom right indicate the number of embryos with similar staining patterns among all embryos examined. n = 3 independent experiments. The white arrowheads indicate proliferating HSPCs. Scale bars, 40 μm. (B) Double immunostaining of cmyb: EGFP and PCNA (upper panels) or pH3 (lower panels) showing the number of proliferating HSPCs in the CHT of siblings and mettl16 mutants at 5 dpf. Numbers at the bottom right indicate the number of embryos with similar staining patterns among all embryos examined. n = 3 independent experiments. Scale bars, 40 μm. (C, D) Flow analysis showing the cell cycle of HSPCs of mettl16-deficient zebrafish at 3 dpf. n ≥ 200 per group, performed with three biological replicates. (E) Flow analysis showing the cell cycle of HSPCs of mettl16-deficient zebrafish at 5 dpf. n ≥ 200 per group, performed with three biological replicates. Data information: In (A, B, D), data were represented as mean ± SEM, * adjusted P < 0.05, ** adjusted P < 0.01, *** adjusted P < 0.001, **** adjusted P < 0.0001, n.s. non-significant, Student’s t-test. Source data are available online for this figure.

Acknowledgments
This image is the copyrighted work of the attributed author or publisher, and ZFIN has permission only to display this image to its users. Additional permissions should be obtained from the applicable author or publisher of the image. Full text @ EMBO J.