FIGURE SUMMARY
Title

A brain-specific angiogenic mechanism enabled by tip cell specialization

Authors
Schevenels, G., Cabochette, P., America, M., Vandenborne, A., De Grande, L., Guenther, S., He, L., Dieu, M., Christou, B., Vermeersch, M., Germano, R.F.V., Perez-Morga, D., Renard, P., Martin, M., Vanlandewijck, M., Betsholtz, C., Vanhollebeke, B.
Source
Full text @ Nature

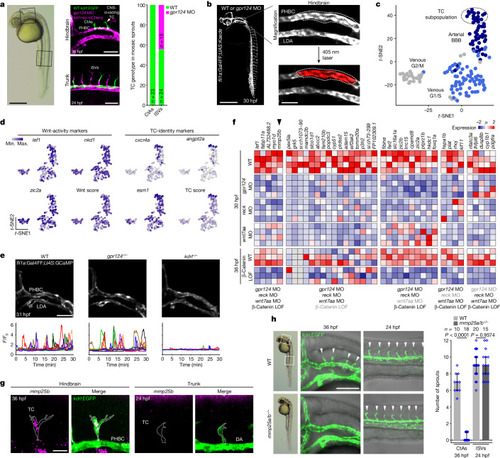
Mmp25 as a regulator of brain-specific angiogenesis.

a, The TC genotype in mosaic sprouts during brain vascular invasion (36 hpf, n = 23 sprouts) and trunk ISV formation (24 hpf, n = 43 ISVs) of embryos obtained by five transplantation experiments of WT kdrl:EGFP donor cells into gpr124 MO-injected kdrl:ras-mCherry hosts. b, In vivo photoconversion design of pre-angiogenic PHBCs. LDA, lateral dorsal aorta. c, t-Distributed stochastic neighbour embedding (t-SNE) analysis of PHBC EC clusters. d, t-SNE expression profiles of Wnt–β-catenin target genes and TC markers. Max., maximum; min., minimum. e, Time-lapse recordings of calcium oscillations in Tg(fli1a:Gal4FF);(UAS:GCaMP7a) PHBCs (31 to 31.5 hpf). f, Wnt-dependent transcripts in 30 hpf PHBCs or 36 hpf CtAs (β-catenin LOF, IWR-1 treatment). Grey labels below the heat map indicate conditions in which candidate genes are not statistically downregulated. μ, mean expression. g, Fluorescent mmp25b WISH and anti-EGFP staining of Tg(kdrl:EGFP) embryos. DA, dorsal aorta. h, Angiogenic sprouts (arrowheads) in the hindbrain and trunk region of Tg(kdrl:EGFP) embryos. n ≥ 10 embryos from 4 independent experiments. Data are median ± interquartile range. P values were calculated using nonparametric two-tailed Mann–Whitney U-tests. Scale bars, 400 μm (a (left) and b (left)), 100 μm (a (right), e and h), 50 μm (b (right)) and 20 μm (g).

Source Data

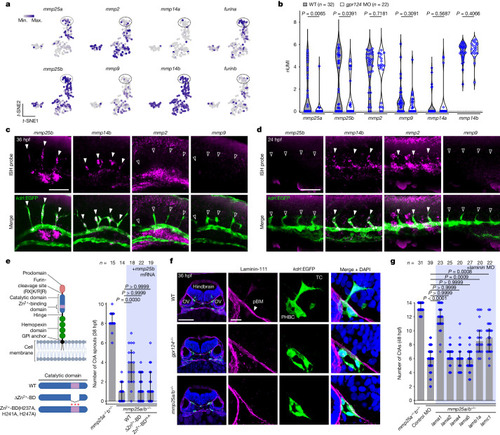
TCs require a specialized MMP repertoire to migrate across the pial basement membrane.

a, t-SNE expression profiles of mmp and furin genes. b, Expression levels of mmp genes in WT and gpr124-MO PHBC ECs. Dots represent individual cells. nUMI, normalized unique molecular identifier. P values were calculated using parametric two-tailed Student’s t-tests. c,d, Fluorescent mmp25b, mmp14b, mmp2 or mmp9 WISH and anti-EGFP staining of Tg(kdrl:EGFP) embryos in the hindbrain (c) and trunk region (d). The solid and open arrowheads label mmp-positive and -negative sprouts, respectively. e, CtA sprouts in 38 hpf Tg(kdrl:EGFP) embryos (n ≥ 14 embryos from ≥3 independent experiments), injected at the one-cell stage with 200 pg of mmp25b mRNA or its variants (left). BD, binding domain; H-A, H237A, H241A, H247A. The diagram was created using BioRender. f, Anti-laminin-111 immunofluorescence staining of transverse hindbrain sections, counterstained with DAPI. OV, otic vesicle. g, Hindbrain CtAs in Tg(kdrl:EGFP) embryos (n ≥ 20 embryos from ≥3 independent experiments) injected with control or laminin MOs. In e and g, data are median ± interquartile range. P values were calculated using nonparametric Kruskal–Wallis tests. Scale bars, 100 μm (f (left)), 50 μm (c and d) and 10 μm (f (right)).

Source Data

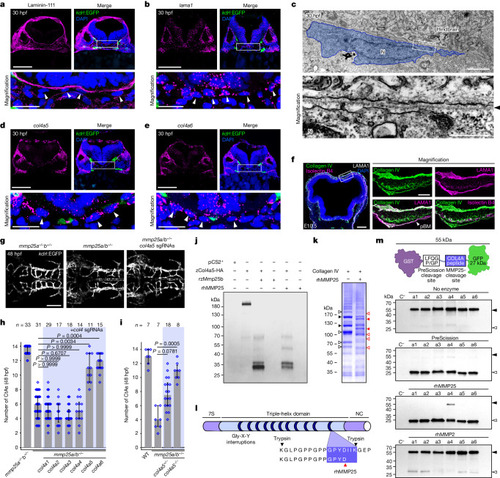
Mmp25 cleaves meningeal fibroblast-derived Col4a5/6.

a,b, Laminin-111 immunostaining (a) and lama1 FISH analysis and EGFP immunostaining (b) of Tg(kdrl:EGFP) transverse zebrafish hindbrain sections, counterstained with DAPI. The arrowheads indicate meningeal fibroblast nuclei. c, Transmission electron micrograph showing a meningeal fibroblast next to the pBM (arrowhead). N, nucleus. d,e, FISH analysis as in b of col4a5 (d) and col4a6 (e) with EGFP immunostaining. f, Collagen IV and laminin-111 (anti-LAMA1) co-immunostaining on a E10.5 mouse forebrain and midbrain section, counterstained with isolectin B4 and DAPI. g,h, Dorsal views (g) and quantification (h) of Tg(kdrl:EGFP) hindbrain CtAs in embryos (n ≥ 11 embryos from 3 independent experiments), injected with the illustrated sgRNAs and zCas9 mRNA. i, Hindbrain CtAs in embryos (n ≥ 7 embryos from 4 independent experiments) crossed to the dragnet col4a5 allele. j, Anti-HA western blot analysis of zCol4a5–HA-containing HEK293T cell extracts (or control pCS2+ cells) that were treated or not with rzMmp25b or rhMMP25. k, Coomassie blue staining of human placental collagen IV exposed or not to rhMMP25. The solid arrowheads indicate parental fragments (black) and rhMMP25 cleavage products (red) analysed by MS. The open arrowheads indicate additional differences. l, Collagen IV and its most C-terminal non-tryptic peptide identified in rhMMP25-treated samples. NC, non-collagenous. m, Anti-GFP western blot analysis of recombinant GST–GFP fusion proteins (black arrowheads) and cleavage products (white arrowheads). GST and GFP are linked by a PreScission recognition site and the presumptive cleavage site of MMP25 in COL4A1–6 (a1 to a6). C, GST alone. The diagram was created using BioRender. For h and i, data are median ± interquartile range. P values were calculated using nonparametric Kruskal–Wallis tests. Scale bars, 500 nm (c (bottom)), 200 μm (f (left)), 100 μm (a, b, d and e (top) and g), 50 μm (f (right)), 20 μm (a, b, d and e (bottom)) and 2 μm (c (top)).

Source Data

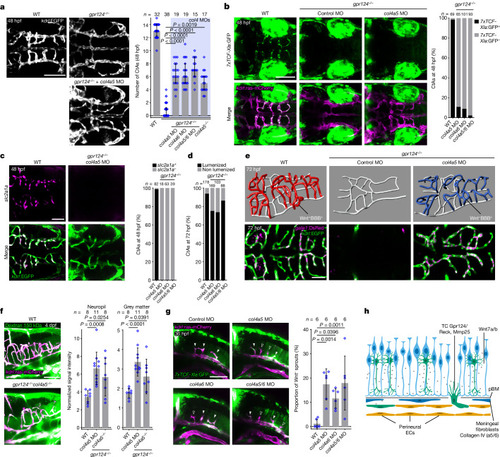
Col4a5/6 inactivation unlocks the quality control of brain angiogenesis by Wnt–β-catenin signalling.

a, Hindbrain CtAs in 48 hpf Tg(kdrl:EGFP) embryos (n ≥ 15 embryos from ≥3 independent experiments). Data are median ± interquartile range. P values were calculated using nonparametric Kruskal–Wallis tests. b, The proportion of 7xTCF-Xla:GFP+ CtAs in Tg(7xTCF-Xla.Siam:GFP);(kdrl:ras-mCherry) 48 hpf embryos. c, The proportion of slc2a1a-positive CtAs was analysed using fluorescent slc2a1a WISH and anti-EGFP immunostaining in Tg(kdrl:EGFP) embryos. d, The percentage of lumenized CtAs in 72 hpf larvae. For bd, n = total number of CtAs from 3 (b and c) or 5 (d) independent experiments. e, Wire diagrams (top) and dorsal views (bottom) of 72 hpf Tg(gata1:DsRed);(kdrl:EGFP) larvae. f, FITC 150 kDa dextran fluorescence intensity 1 h after intracardial injection in larvae at 4 days post-fertilization (dpf). n ≥ 8 larvae from ≥4 independent experiments. g, The proportion of 7xTCF-Xla:GFP CtA TCs in Tg(7xTCF-Xla.Siam:GFP);(kdrl:ras-mCherry) embryos. The solid and open arrowheads label 7xTCF-Xla:GFP+ and 7xTCF-Xla:GFP sprouts, respectively. n = 6 independent experiments with ≥6 embryos each. For f and g, data are mean ± s.d. P values were calculated using parametric one-way ANOVA. h, Model for brain-specific angiogenesis. The diagram was created using BioRender. Scale bars, 100 μm (a, b, f and g) and 50 μm (c and e).

Source Data

Acknowledgments
This image is the copyrighted work of the attributed author or publisher, and ZFIN has permission only to display this image to its users. Additional permissions should be obtained from the applicable author or publisher of the image. Full text @ Nature