|
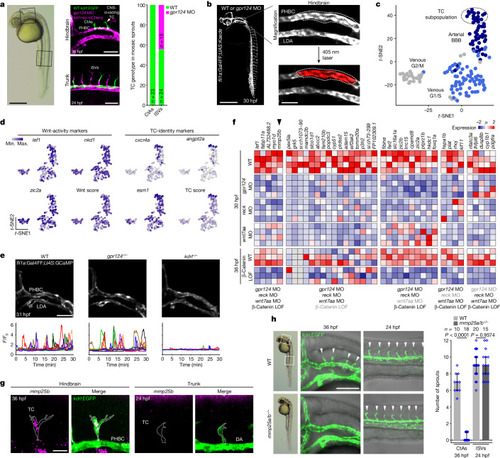
Mmp25 as a regulator of brain-specific angiogenesis. a, The TC genotype in mosaic sprouts during brain vascular invasion (36 hpf, n = 23 sprouts) and trunk ISV formation (24 hpf, n = 43 ISVs) of embryos obtained by five transplantation experiments of WT kdrl:EGFP donor cells into gpr124 MO-injected kdrl:ras-mCherry hosts. b, In vivo photoconversion design of pre-angiogenic PHBCs. LDA, lateral dorsal aorta. c, t-Distributed stochastic neighbour embedding (t-SNE) analysis of PHBC EC clusters. d, t-SNE expression profiles of Wnt–β-catenin target genes and TC markers. Max., maximum; min., minimum. e, Time-lapse recordings of calcium oscillations in Tg(fli1a:Gal4FF);(UAS:GCaMP7a) PHBCs (31 to 31.5 hpf). f, Wnt-dependent transcripts in 30 hpf PHBCs or 36 hpf CtAs (β-catenin LOF, IWR-1 treatment). Grey labels below the heat map indicate conditions in which candidate genes are not statistically downregulated. μ, mean expression. g, Fluorescent mmp25b WISH and anti-EGFP staining of Tg(kdrl:EGFP) embryos. DA, dorsal aorta. h, Angiogenic sprouts (arrowheads) in the hindbrain and trunk region of Tg(kdrl:EGFP) embryos. n ≥ 10 embryos from 4 independent experiments. Data are median ± interquartile range. P values were calculated using nonparametric two-tailed Mann–Whitney U-tests. Scale bars, 400 μm (a (left) and b (left)), 100 μm (a (right), e and h), 50 μm (b (right)) and 20 μm (g). Source Data
|