|
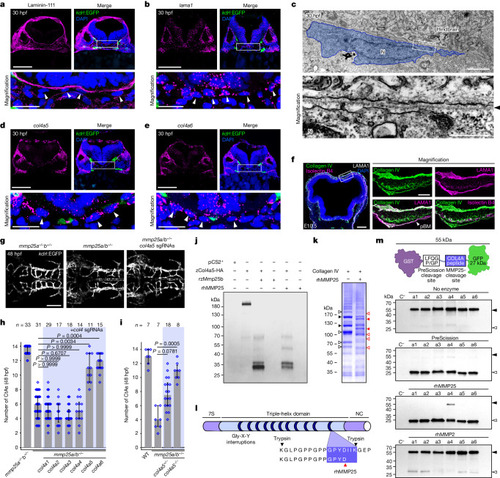
Mmp25 cleaves meningeal fibroblast-derived Col4a5/6. a,b, Laminin-111 immunostaining (a) and lama1 FISH analysis and EGFP immunostaining (b) of Tg(kdrl:EGFP) transverse zebrafish hindbrain sections, counterstained with DAPI. The arrowheads indicate meningeal fibroblast nuclei. c, Transmission electron micrograph showing a meningeal fibroblast next to the pBM (arrowhead). N, nucleus. d,e, FISH analysis as in b of col4a5 (d) and col4a6 (e) with EGFP immunostaining. f, Collagen IV and laminin-111 (anti-LAMA1) co-immunostaining on a E10.5 mouse forebrain and midbrain section, counterstained with isolectin B4 and DAPI. g,h, Dorsal views (g) and quantification (h) of Tg(kdrl:EGFP) hindbrain CtAs in embryos (n ≥ 11 embryos from 3 independent experiments), injected with the illustrated sgRNAs and zCas9 mRNA. i, Hindbrain CtAs in embryos (n ≥ 7 embryos from 4 independent experiments) crossed to the dragnet col4a5 allele. j, Anti-HA western blot analysis of zCol4a5–HA-containing HEK293T cell extracts (or control pCS2+ cells) that were treated or not with rzMmp25b or rhMMP25. k, Coomassie blue staining of human placental collagen IV exposed or not to rhMMP25. The solid arrowheads indicate parental fragments (black) and rhMMP25 cleavage products (red) analysed by MS. The open arrowheads indicate additional differences. l, Collagen IV and its most C-terminal non-tryptic peptide identified in rhMMP25-treated samples. NC, non-collagenous. m, Anti-GFP western blot analysis of recombinant GST–GFP fusion proteins (black arrowheads) and cleavage products (white arrowheads). GST and GFP are linked by a PreScission recognition site and the presumptive cleavage site of MMP25 in COL4A1–6 (a1 to a6). C−, GST alone. The diagram was created using BioRender. For h and i, data are median ± interquartile range. P values were calculated using nonparametric Kruskal–Wallis tests. Scale bars, 500 nm (c (bottom)), 200 μm (f (left)), 100 μm (a, b, d and e (top) and g), 50 μm (f (right)), 20 μm (a, b, d and e (bottom)) and 2 μm (c (top)). Source Data
|