IMAGE

Fig. 4

ID
ZDB-IMAGE-240425-48
Source
Figures for Schevenels et al., 2024
Image
Figure Caption

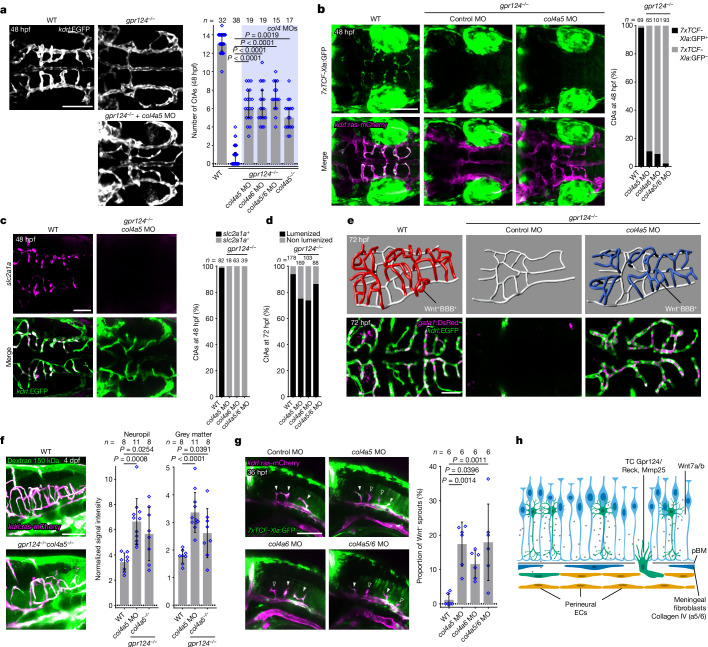
Fig. 4 Col4a5/6 inactivation unlocks the quality control of brain angiogenesis by Wnt–β-catenin signalling.

a, Hindbrain CtAs in 48 hpf Tg(kdrl:EGFP) embryos (n ≥ 15 embryos from ≥3 independent experiments). Data are median ± interquartile range. P values were calculated using nonparametric Kruskal–Wallis tests. b, The proportion of 7xTCF-Xla:GFP+ CtAs in Tg(7xTCF-Xla.Siam:GFP);(kdrl:ras-mCherry) 48 hpf embryos. c, The proportion of slc2a1a-positive CtAs was analysed using fluorescent slc2a1a WISH and anti-EGFP immunostaining in Tg(kdrl:EGFP) embryos. d, The percentage of lumenized CtAs in 72 hpf larvae. For bd, n = total number of CtAs from 3 (b and c) or 5 (d) independent experiments. e, Wire diagrams (top) and dorsal views (bottom) of 72 hpf Tg(gata1:DsRed);(kdrl:EGFP) larvae. f, FITC 150 kDa dextran fluorescence intensity 1 h after intracardial injection in larvae at 4 days post-fertilization (dpf). n ≥ 8 larvae from ≥4 independent experiments. g, The proportion of 7xTCF-Xla:GFP CtA TCs in Tg(7xTCF-Xla.Siam:GFP);(kdrl:ras-mCherry) embryos. The solid and open arrowheads label 7xTCF-Xla:GFP+ and 7xTCF-Xla:GFP sprouts, respectively. n = 6 independent experiments with ≥6 embryos each. For f and g, data are mean ± s.d. P values were calculated using parametric one-way ANOVA. h, Model for brain-specific angiogenesis. The diagram was created using BioRender. Scale bars, 100 μm (a, b, f and g) and 50 μm (c and e).

Source Data

Acknowledgments
This image is the copyrighted work of the attributed author or publisher, and ZFIN has permission only to display this image to its users. Additional permissions should be obtained from the applicable author or publisher of the image. Full text @ Nature