|
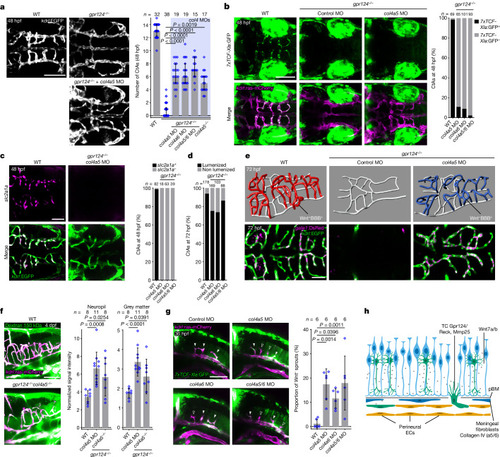
Col4a5/6 inactivation unlocks the quality control of brain angiogenesis by Wnt–β-catenin signalling. a, Hindbrain CtAs in 48 hpf Tg(kdrl:EGFP) embryos (n ≥ 15 embryos from ≥3 independent experiments). Data are median ± interquartile range. P values were calculated using nonparametric Kruskal–Wallis tests. b, The proportion of 7xTCF-Xla:GFP+ CtAs in Tg(7xTCF-Xla.Siam:GFP);(kdrl:ras-mCherry) 48 hpf embryos. c, The proportion of slc2a1a-positive CtAs was analysed using fluorescent slc2a1a WISH and anti-EGFP immunostaining in Tg(kdrl:EGFP) embryos. d, The percentage of lumenized CtAs in 72 hpf larvae. For b–d, n = total number of CtAs from 3 (b and c) or 5 (d) independent experiments. e, Wire diagrams (top) and dorsal views (bottom) of 72 hpf Tg(gata1:DsRed);(kdrl:EGFP) larvae. f, FITC 150 kDa dextran fluorescence intensity 1 h after intracardial injection in larvae at 4 days post-fertilization (dpf). n ≥ 8 larvae from ≥4 independent experiments. g, The proportion of 7xTCF-Xla:GFP– CtA TCs in Tg(7xTCF-Xla.Siam:GFP);(kdrl:ras-mCherry) embryos. The solid and open arrowheads label 7xTCF-Xla:GFP+ and 7xTCF-Xla:GFP– sprouts, respectively. n = 6 independent experiments with ≥6 embryos each. For f and g, data are mean ± s.d. P values were calculated using parametric one-way ANOVA. h, Model for brain-specific angiogenesis. The diagram was created using BioRender. Scale bars, 100 μm (a, b, f and g) and 50 μm (c and e). Source Data
|