IMAGE

Fig. 2

ID
ZDB-IMAGE-240425-46
Source
Figures for Schevenels et al., 2024
Image
Figure Caption

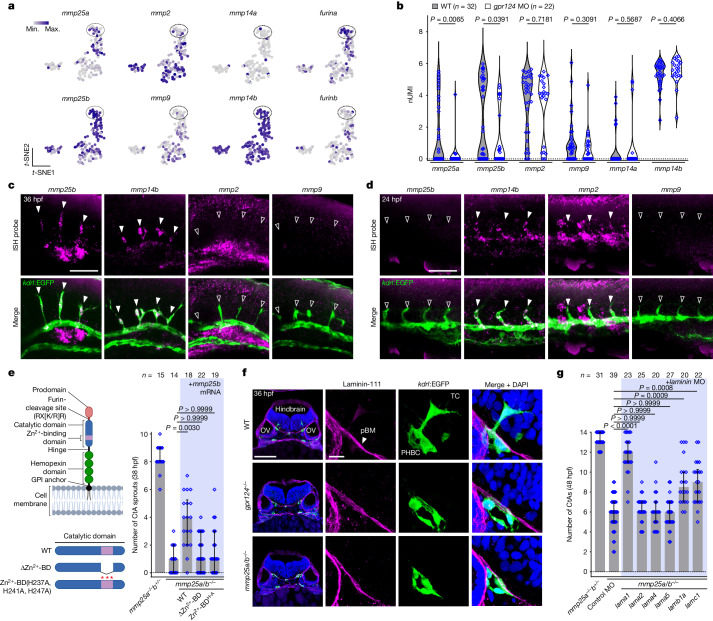
Fig. 2 TCs require a specialized MMP repertoire to migrate across the pial basement membrane.

a, t-SNE expression profiles of mmp and furin genes. b, Expression levels of mmp genes in WT and gpr124-MO PHBC ECs. Dots represent individual cells. nUMI, normalized unique molecular identifier. P values were calculated using parametric two-tailed Student’s t-tests. c,d, Fluorescent mmp25b, mmp14b, mmp2 or mmp9 WISH and anti-EGFP staining of Tg(kdrl:EGFP) embryos in the hindbrain (c) and trunk region (d). The solid and open arrowheads label mmp-positive and -negative sprouts, respectively. e, CtA sprouts in 38 hpf Tg(kdrl:EGFP) embryos (n ≥ 14 embryos from ≥3 independent experiments), injected at the one-cell stage with 200 pg of mmp25b mRNA or its variants (left). BD, binding domain; H-A, H237A, H241A, H247A. The diagram was created using BioRender. f, Anti-laminin-111 immunofluorescence staining of transverse hindbrain sections, counterstained with DAPI. OV, otic vesicle. g, Hindbrain CtAs in Tg(kdrl:EGFP) embryos (n ≥ 20 embryos from ≥3 independent experiments) injected with control or laminin MOs. In e and g, data are median ± interquartile range. P values were calculated using nonparametric Kruskal–Wallis tests. Scale bars, 100 μm (f (left)), 50 μm (c and d) and 10 μm (f (right)).

Source Data

Acknowledgments
This image is the copyrighted work of the attributed author or publisher, and ZFIN has permission only to display this image to its users. Additional permissions should be obtained from the applicable author or publisher of the image. Full text @ Nature