
- Title
-
Formation of different polyploids through disrupting meiotic crossover frequencies based on cntd1 knockout in zebrafish
- Authors
- Ou, Y., Li, H., Li, J., Dai, X., He, J., Wang, S., Liu, Q., Yang, C., Wang, J., Zhao, R., Yin, Z., Shu, Y., Liu, S.
- Source
- Full text @ Mol Bio Evol
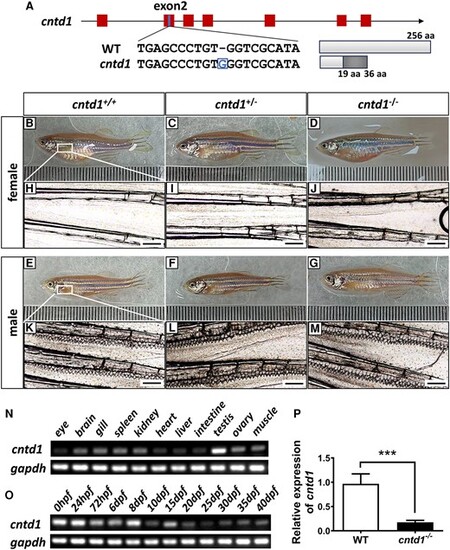
Generation of cntd1 knockout zebrafish. A, Schematic representation of the genomic structures of the zebrafish cntd1 gene and the corresponding putative peptides and the target sites of engineered CRISPR-Cas9 in exon 2 (exons shown in red). The inserted base is highlighted in the blue box. The correct amino acids are indicated by white boxes, while the incorrect amino acids in cntd1 mutants are presented in a dark box. B–G, General morphological observations of zebrafish with different genotypes: cntd1+/+ (B), cntd1+/− (C), and cntd1−/− (D) females; cntd1+/+ (E), cntd1+/− (F), and cntd1−/− (G) males. H–M, Microscopic observation of the central fin rays on the pectoral fins. Absence of breeding tubercles in cntd1+/+ (H), cntd1+/− (I), and cntd1−/− (J) females; the presence of spike-like breeding tubercle clusters in cntd1+/+ (K), cntd1+/− (L), and cntd1−/− (M) males. Scale bar: 200 μm. (N) Tissue distribution of endogenous cntd1 transcripts with RT-PCR in WT zebrafish. (O) Expression levels of endogenous cntd1 at different developmental stages checked by RT-PCR in WT zebrafish. (P) Relative expressions of cntd1 in the testis of WT and cntd1−/− zebrafish. Six individuals were used, and ef1α was selected as the internal reference in this experiment. The error bars represent the means ± SDs; “***” above the error bar indicates statistically significant differences at P < 0.001 by two-tailed Student's t-test. |
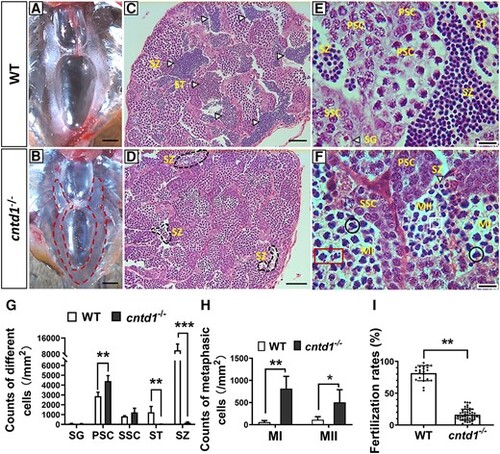
Characterization of testis development and spermatogenesis. A and B, Anatomical views of the testes from wild-type (WT) (A) and cntd1−/− (B) males, with the red dotted line highlighting the mutant testis. The scale bar represents 1 mm. C–F, Histological analysis of testes from WT (C and E) and cntd1−/− (D and F) zebrafish, showing both a macroscopic view (C and D) and a magnified view (E and F) of the testes structure in WT and cntd1−/− zebrafish. The arrows indicate spermatogonia, spermatids, and spermatozoa. Black circles mark cells arrested at meiotic metaphase I, red boxes highlight arrested cells with abnormal chromosome segregation, and the white box indicates cells arrested at meiotic metaphase II. Abbreviations: ST, spermatid; SZ, spermatozoon; SG, spermatogonia; PSC, primary spermatocyte; SSC, secondary spermatocyte; MI, meiotic metaphase I; MII, meiotic metaphase II. Scale bars in C–D and E–F represent 100 and 20 μm, respectively. (G) Statistical analysis of testicular cell composition in WT and cntd1−/− zebrafish. (H) Statistical analysis of spermatocytes arrested at meiotic metaphases I and II. Each group in G and H contains three individuals for statistical analysis. (I) Statistical analysis of the fertilization rates in WT and cntd1−/− males, with each group containing more than ten individuals for statistical purposes. Error bars represent the means ± standard deviations (SDs); “*,” “**,” and “***” asterisks above the error bar indicate statistically significant differences at 0.01 < P < 0.05, 0.001 < P < 0.01, and P < 0.001, respectively, as determined by a two-tailed Student's t-test. |
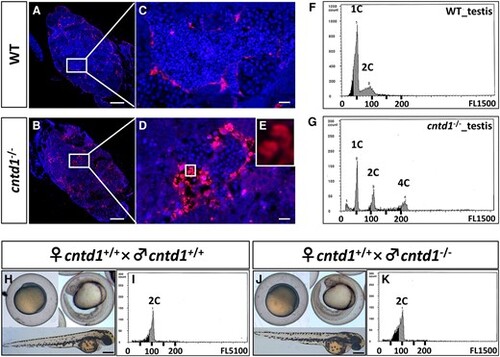
Observations of spermatocyte apoptosis. A–D, TUNEL staining of testes from wild-type (WT) (A and C) and cntd1−/− zebrafish (B and D). Each group consists of four individuals. White boxes highlight the magnified areas. Scale bars in A and B and C and D represent 100 and 10 μm, respectively. (E) Magnification of the area indicated by the white box. F and G, Representative cytometric histograms of testes from WT (F) and cntd1−/− (G) zebrafish, with each group comprising three individuals. The terms 1C, 2C, and 4C denote haploidy, diploidy, and tetraploidy, respectively. H and J, Representative images of embryonic development in offspring obtained from cntd1+/+ females crossed with cntd1+/+ (H) and cntd1−/− (J) males, with a scale bar representing 250 μm. I and K, Cytometric histograms of embryos obtained from cntd1+/+ females crossed with cntd1+/+ (I) and cntd1−/− (K) males. Each group includes 20 individuals. The term 2C indicates diploidy. |
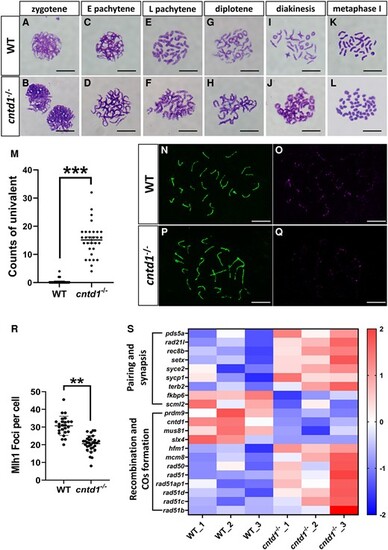
Observations of meiotic chromosome behavior during spermatogenesis. A and B, Spermatocytes at the zygotene stage in wild-type (WT) (A) and cntd1−/− (B) zebrafish. C and D, Spermatocytes at the early pachytene stage in WT (C) and cntd1−/− (D) zebrafish with “E” indicating “early.” E and F, Spermatocytes at the late pachytene stage in WT (E) and cntd1−/− (F) zebrafish with “L” indicating “late.” G and H, Spermatocytes at the diplotene stage in WT (G) and cntd1−/− (H) zebrafish. I and J, Spermatocytes at the diakinesis stage in WT (I) and cntd1−/− (J) zebrafish. K and L, Spermatocytes at the metaphase I stage in WT (K) and cntd1−/− (L) zebrafish. The scale bar in A–L represents 10 μm. (M) Statistical analysis of univalent at the metaphase I stage in WT and cntd1−/− zebrafish. For this analysis, two testes isolated from the WT and cntd1−/− males were collected as one sample, and three such samples were used. (N and O) Immunofluorescent staining of WT zebrafish spermatocytes with antibodies against Sycp3 (N) and Mlh1 (O). P and Q, Immunofluorescent staining of cntd1−/− zebrafish spermatocytes with antibodies against Sycp3 (P) and Mlh1 (Q). The scale bar in N–Q represents 10 μm. R, Statistical analysis of Mlh1 signals in WT and cntd1−/− zebrafish, with two testes collected as one sample and three such samples used for the analysis. (S) Hierarchical clustering of meiosis-related genes based on transcriptome analysis. The error bars represent the means ± standard deviations (SDs); “**” and “***” above the error bar indicate statistically significant differences at 0.001 < P < 0.01 and P < 0.001, respectively, as determined by a two-tailed Student's t-test. |
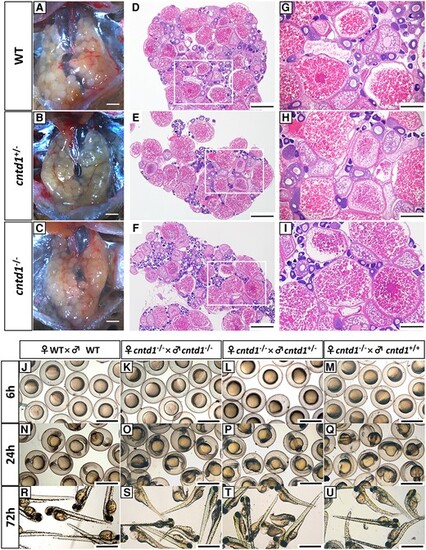
Observations of ovarian development and reproduction. A–C, Anatomical views of the ovaries from wild-type (WT) (A), cntd1+/− (B), and cntd1−/− (C) females, with each group consisting of three individuals. The scale bar in A–C represents 1 mm. D–I, Histological observations of the ovaries from WT (D and G), cntd1+/− (E and H), and cntd1−/− (F and I) females. Both a holistic view (D–F) and a magnified view (G–I) of the ovarian section are provided. White boxes highlight the magnified areas. Scale bars in D–F and G–I represent 0.5 and 200 μm, respectively. J–M, Embryos obtained from self-crossing of WT zebrafish (J) and cntd1−/− females crossed with cntd1−/− (K), cntd1+/− (L), and cntd1+/+ (M) males at 6 h postfertilization (hpf). N–Q, Embryos obtained from self-crossing of WT zebrafish (N) and cntd1−/− females crossed with cntd1−/− (O), cntd1+/− (P), and cntd1+/+ (Q) males at 24 hpf. R–U, Embryos obtained from self-crossing of WT zebrafish (R) and cntd1−/− females crossed with cntd1−/− (S), cntd1+/− (T), and cntd1+/+ (U) males at 72 hpf. The scale bar in J–U represents 1 mm. |
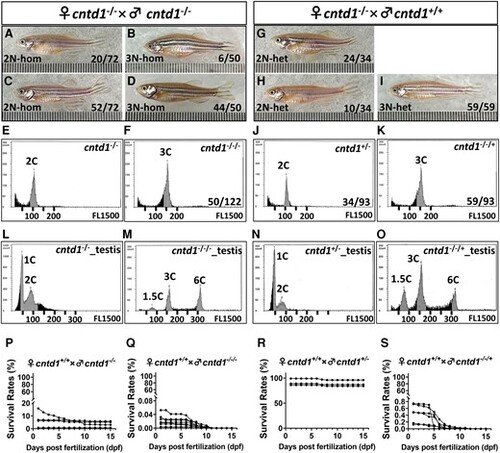
Generation of diploid and triploid progeny by cntd1−/− females. A–D, Adult offspring resulting from the self-crossing of cntd1−/− zebrafish, including diploid females (A), males (C), and triploid females (B) and males (D). E and F, Representative flow cytometry results of red blood cells from cntd1−/− (E) and cntd1−/−/− (F) zebrafish. G–I, Adult offspring obtained from the cross between female cntd1−/− and cntd1+/+ males, including diploid females (G), males (H), and triploid males (I). J and K, Representative flow cytometry results of red blood cells from cntd1+/− (J) and cntd1−/−/+ (K) zebrafish. L–O, Representative flow cytometry results of testicular cells from cntd1−/− (L) and cntd1−/−/− (M) zebrafish, as well as cntd1+/− (N) and cntd1−/−/+ (O) zebrafish. The terms 1C, 1.5C, 2C, 3C, and 6C denote haploidy, aneuploidy, diploidy, triploidy, and hexaploidy, respectively. P–S, Survival rates of the offspring normalized to the total number of spawning eggs obtained from cntd1+/+ females crossed with cntd1−/− (P) and cntd1−/−/− (Q) males, as well as cntd1+/− (R) and cntd1−/−/+ (S) males. |
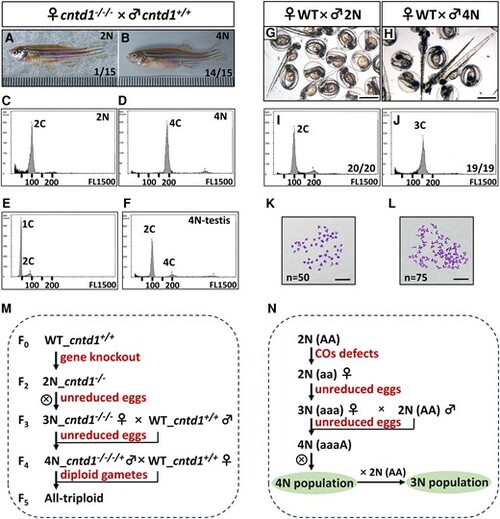
Generation of tetraploid zebrafish by cntd1−/−/− females. A and B, Adult progeny obtained from cntd1−/−/− females crossed with cntd1+/+ males, showcasing both diploid (A) and tetraploid (B) offspring. C and D, Representative flow cytometry results of red blood cells from diploid (C) and tetraploid (D) offspring. E and F, Representative flow cytometry results of testicular cells from diploid (E) and tetraploid (F) zebrafish. The terms 1C, 2C, and 4C indicate haploidy, diploidy, and tetraploidy, respectively. G and H, Images of progeny obtained from wild-type (WT) females crossed with diploid (G) and tetraploid (H) males at 72 h postfertilization (hpf), with a scale bar representing 1 mm. I and J, Representative flow cytometry results of progeny from diploid (I) and tetraploid (J) males crossed with WT females. The terms 2C and 3C indicate diploidy and triploidy, respectively. K and L, Chromosome spreads of embryos from WT females crossed with diploid (K) and tetraploid (L) males, with a scale bar representing 10 μm. M, Formation of different polyploids in zebrafish based on cntd1 knockout. N, A potential model of polyploidization in vertebrates due to naturally induced defects in crossover formation. |