
Fig. 6
- ID
- ZDB-FIG-240510-40
- Publication
- Ou et al., 2024 - Formation of different polyploids through disrupting meiotic crossover frequencies based on cntd1 knockout in zebrafish
- Other Figures
- All Figure Page
- Back to All Figure Page
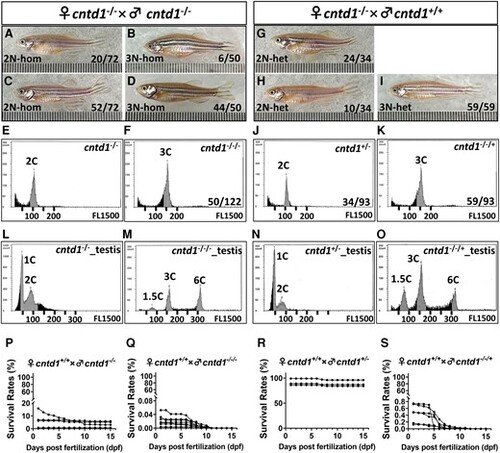
Generation of diploid and triploid progeny by cntd1−/− females. A–D, Adult offspring resulting from the self-crossing of cntd1−/− zebrafish, including diploid females (A), males (C), and triploid females (B) and males (D). E and F, Representative flow cytometry results of red blood cells from cntd1−/− (E) and cntd1−/−/− (F) zebrafish. G–I, Adult offspring obtained from the cross between female cntd1−/− and cntd1+/+ males, including diploid females (G), males (H), and triploid males (I). J and K, Representative flow cytometry results of red blood cells from cntd1+/− (J) and cntd1−/−/+ (K) zebrafish. L–O, Representative flow cytometry results of testicular cells from cntd1−/− (L) and cntd1−/−/− (M) zebrafish, as well as cntd1+/− (N) and cntd1−/−/+ (O) zebrafish. The terms 1C, 1.5C, 2C, 3C, and 6C denote haploidy, aneuploidy, diploidy, triploidy, and hexaploidy, respectively. P–S, Survival rates of the offspring normalized to the total number of spawning eggs obtained from cntd1+/+ females crossed with cntd1−/− (P) and cntd1−/−/− (Q) males, as well as cntd1+/− (R) and cntd1−/−/+ (S) males. |