
|
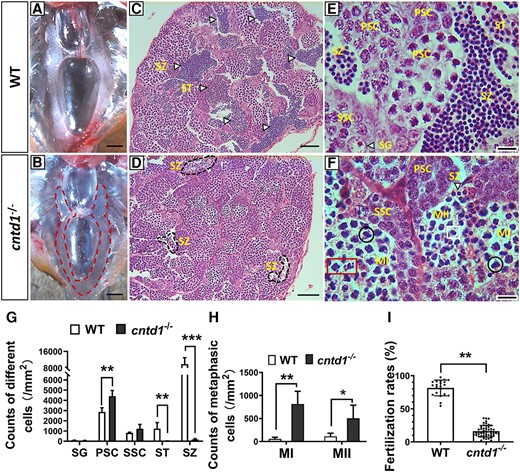
Fig. 2 Characterization of testis development and spermatogenesis. A and B, Anatomical views of the testes from wild-type (WT) (A) and cntd1−/− (B) males, with the red dotted line highlighting the mutant testis. The scale bar represents 1 mm. C–F, Histological analysis of testes from WT (C and E) and cntd1−/− (D and F) zebrafish, showing both a macroscopic view (C and D) and a magnified view (E and F) of the testes structure in WT and cntd1−/− zebrafish. The arrows indicate spermatogonia, spermatids, and spermatozoa. Black circles mark cells arrested at meiotic metaphase I, red boxes highlight arrested cells with abnormal chromosome segregation, and the white box indicates cells arrested at meiotic metaphase II. Abbreviations: ST, spermatid; SZ, spermatozoon; SG, spermatogonia; PSC, primary spermatocyte; SSC, secondary spermatocyte; MI, meiotic metaphase I; MII, meiotic metaphase II. Scale bars in C–D and E–F represent 100 and 20 μm, respectively. (G) Statistical analysis of testicular cell composition in WT and cntd1−/− zebrafish. (H) Statistical analysis of spermatocytes arrested at meiotic metaphases I and II. Each group in G and H contains three individuals for statistical analysis. (I) Statistical analysis of the fertilization rates in WT and cntd1−/− males, with each group containing more than ten individuals for statistical purposes. Error bars represent the means ± standard deviations (SDs); “*,” “**,” and “***” asterisks above the error bar indicate statistically significant differences at 0.01 < P < 0.05, 0.001 < P < 0.01, and P < 0.001, respectively, as determined by a two-tailed Student's t-test.