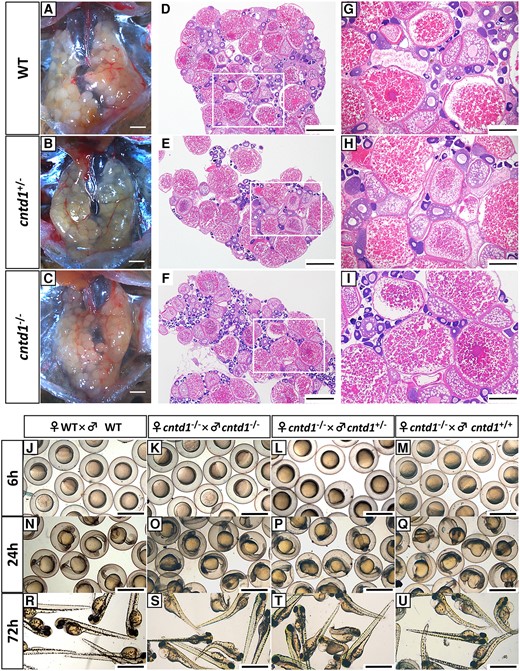
Fig. 5 Observations of ovarian development and reproduction. A–C, Anatomical views of the ovaries from wild-type (WT) (A), cntd1+/− (B), and cntd1−/− (C) females, with each group consisting of three individuals. The scale bar in A–C represents 1 mm. D–I, Histological observations of the ovaries from WT (D and G), cntd1+/− (E and H), and cntd1−/− (F and I) females. Both a holistic view (D–F) and a magnified view (G–I) of the ovarian section are provided. White boxes highlight the magnified areas. Scale bars in D–F and G–I represent 0.5 and 200 μm, respectively. J–M, Embryos obtained from self-crossing of WT zebrafish (J) and cntd1−/− females crossed with cntd1−/− (K), cntd1+/− (L), and cntd1+/+ (M) males at 6 h postfertilization (hpf). N–Q, Embryos obtained from self-crossing of WT zebrafish (N) and cntd1−/− females crossed with cntd1−/− (O), cntd1+/− (P), and cntd1+/+ (Q) males at 24 hpf. R–U, Embryos obtained from self-crossing of WT zebrafish (R) and cntd1−/− females crossed with cntd1−/− (S), cntd1+/− (T), and cntd1+/+ (U) males at 72 hpf. The scale bar in J–U represents 1 mm.
Image
Figure Caption
Acknowledgments
This image is the copyrighted work of the attributed author or publisher, and
ZFIN has permission only to display this image to its users.
Additional permissions should be obtained from the applicable author or publisher of the image.
Full text @ Mol Bio Evol

