
Fig. 7
- ID
- ZDB-FIG-240510-41
- Publication
- Ou et al., 2024 - Formation of different polyploids through disrupting meiotic crossover frequencies based on cntd1 knockout in zebrafish
- Other Figures
- All Figure Page
- Back to All Figure Page
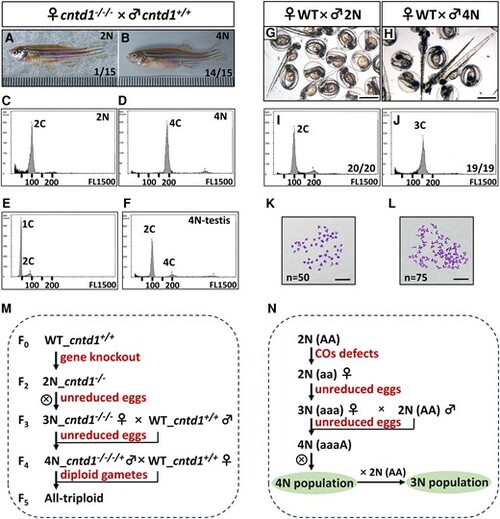
Generation of tetraploid zebrafish by cntd1−/−/− females. A and B, Adult progeny obtained from cntd1−/−/− females crossed with cntd1+/+ males, showcasing both diploid (A) and tetraploid (B) offspring. C and D, Representative flow cytometry results of red blood cells from diploid (C) and tetraploid (D) offspring. E and F, Representative flow cytometry results of testicular cells from diploid (E) and tetraploid (F) zebrafish. The terms 1C, 2C, and 4C indicate haploidy, diploidy, and tetraploidy, respectively. G and H, Images of progeny obtained from wild-type (WT) females crossed with diploid (G) and tetraploid (H) males at 72 h postfertilization (hpf), with a scale bar representing 1 mm. I and J, Representative flow cytometry results of progeny from diploid (I) and tetraploid (J) males crossed with WT females. The terms 2C and 3C indicate diploidy and triploidy, respectively. K and L, Chromosome spreads of embryos from WT females crossed with diploid (K) and tetraploid (L) males, with a scale bar representing 10 μm. M, Formation of different polyploids in zebrafish based on cntd1 knockout. N, A potential model of polyploidization in vertebrates due to naturally induced defects in crossover formation. |