FIGURE SUMMARY
Title

Sinus venosus adaptation models prolonged cardiovascular disease and reveals insights into evolutionary transitions of the vertebrate heart

Authors
Gafranek, J.T., D'Aniello, E., Ravisankar, P., Thakkar, K., Vagnozzi, R.J., Lim, H.W., Salomonis, N., Waxman, J.S.
Source
Full text @ Nat. Commun.

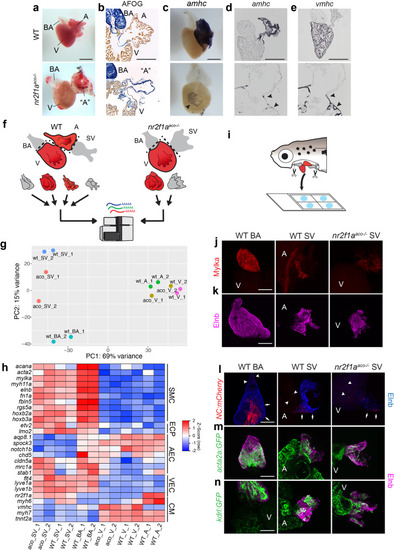
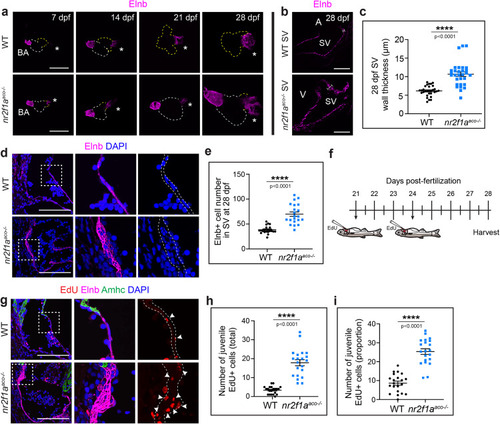
Inflow tract tissue adjacent to the venous pole of the heart tissue expands in adult nr2f1a mutants lacking an atrium.

a Brightfield images of whole hearts from adult WT and nr2f1aaco−/− fish. Bulbus arteriosus (BA), Ventricle (V), Atrium (A), putative Atrium (“A”). b Brightfield images of sectioned hearts stained with AFOG. Cardiac muscle – brownish-orange, Collagen - blue, fibrin - red. c ISH for amhc on adult WT and nr2f1aaco mutant hearts. Amhc (arrowhead) in nr2f1aaco mutant hearts is a relatively small ring adjacent to the ventricle. d, e ISH for amhc and vmhc on sectioned hearts. A restricted ring of CMs expressed both these atrial and ventricular differentiation marker genes adjacent to the venous pole of the heart (black arrowheads) f. Schematic depicting subunits of the zebrafish hearts harvested for bulk RNA-seq. g PCA analysis from the bulk RNA-seq BA, SV, A, and V samples. The SV from nr2f1aaco mutant fish occupies space between the WT SV and BA. h Heatmap of representative marker genes summarizing SMC, EC progenitor (ECP), arterial EC (AEC), venous EC (VEC), and cardiomyocyte (CM) markers. i Schematic of the preparation procedure of juvenile hearts for wholemount IHC. j, k Confocal images of wholemount IHC of SMC markers Myosin light chain kinase a (Mylka - red) and Elastin b (Elnb - magenta) in 28 dpf hearts. l–n Confocal images of wholemount IHC of BA and SV with transgenic reporters for NC-derived cells Tg(NC:mCherry), SMCs Tg(acta2:EGFP), and vascular ECs Tg(kdrl:EGFP). NC-derived cells within the large chamber-like vessels (arrows). NC-derived contribution to adjacent tissues (arrowhead). Scale bars − 500 μm.

Nr2f1a mutant SV undergoes adaptive remodeling via proliferation of smooth muscle cells.

a Confocal images of Elnb IHC in whole hearts from WT and nr2f1aaco fish at weekly intervals through 28 dpf. Venous pole (asterisks). Dashed lines outline the myocardium (white - ventricle, yellow - atrium). WT 21 dpf and 28 dpf images just show the atrium and venous pole. Scale bars – 200 μm. b Confocal images of IHC for Elnb on mid-sagittal sections showing the SV at 28 dpf. Bars indicate thickness. Scale bars − 100 μm. c Quantification of SV wall thickness (µm) in sections (n = 10 fish). Individual points on the graphs represent a single section averaged from 10 measurements from a single section (3 total sections per fish). 3 adjacent sections were analyzed per fish. d Confocal images of IHC for Elnb (magenta) and DAPI (blue) staining on sagittal sections showing the SV at 28 dpf. DAPI+ nuclei within the Elnb staining of the whole sections were counted. Boxes show the regions of the higher magnification. Dashed outline indicates the Elnb+ region. Scale bars – 50 μm. e Quantification of Elnb-surrounded cells (DAPI+ nuclei) within sections of the SV (n = 7 fish per group). 3 adjacent sections were quantified per fish. f Schematic of EdU labeling with intrathoracic injections in juvenile zebrafish. g Confocal images of sagittal sections from juvenile WT and nr2f1aaco mutant fish showing the SV following detection of EdU (red) incorporation. Boxes indicate regions of higher magnification. Dashed outline indicates DAPI+ nuclei (blue) within the Elnb+ (magenta) tissue. Amhc (green) was used as control to mark the border of the SV. White arrowheads indicate EdU+ nuclei embedded in the Elnb+ tissue of the SV. Scale bars – 50 μm. h, i Quantification of a total number of Elnb-surrounded EdU+ nuclei and the proportion of Elnb-surrounded EdU+ to total (DAPI+) nuclei within sections SV (n = 7 fish per group). Individual points represent 1 section with 3 sections counted per fish. An unpaired, two-sided Student’s t-test was used to assess statistical differences between WT and nr2f1aaco in all graphs. Comparisons marked ****p < 0.0001. Error bars represent the mean +/− SEM. Source data are provided as a Source Data file.

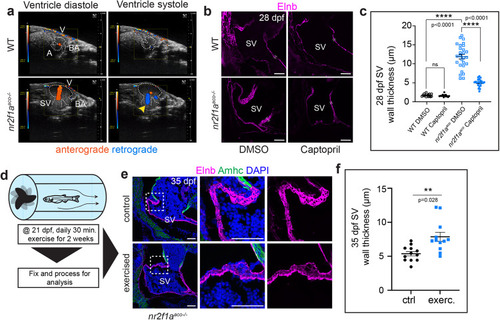
Aberrant blood flow contributes to remodeling in nr2f1a mutant hearts.

a Ultrasound images from echocardiography were conducted on adult WT and nr2f1aaco mutant fish. Anterior is to the right and ventral is up. Flow direction was pseudo-colored for ease of clearly discerning anterograde ventricular inflow (orange) and retrograde outflow (blue). Dashed lines denote the borders of heart. Yellow arrowhead indicates the location of regurgitation in nr2f1aaco mutant heart. Still images were isolated from Supplementary Movies 1 and 2. n = 3 WT and nr2f1aaco mutant fish were examined. b Confocal images of sagittal sections from 28 dpf WT and nr2f1aaco mutant fish treated with either Captopril or DMSO (control). Scale bars – 100 μm. c Quantification of Elnb+ wall thickness (µm) at 28 dpf following Captopril treatments began at 14 dpf. Individual points on the graphs represent 10 measurements averaged from different regions of the SV in a single section (3 total sections per fish). (n = 5 for WT control and treated groups, n = 9 for nr2f1aaco control group, n = 7 for nr2f1aaco treated group). Statistical significance was calculated using an ordinary one-way ANOVA with multiple comparisons. Comparisons marked ****p < 0.0001. Source data are provided as a Source Data file. d Schematic outlining the juvenile exercise regimen beginning at 21 dpf. e Confocal images of sagittal sections showing immunostaining detecting Elnb (magenta), Amhc (green), and DAPI+ nuclei (blue) in the SV of unexercised (control) and exercised nr2f1aaco mutant fish following 2 weeks of daily exercise. Scale bars − 50 μm. f Quantification of Elnb+ wall thickness at 35 dpf following 2 weeks of daily exercise (n = 4 fish per group). Individual points on the graphs represent 20 measurements averaged from different regions of the SV in a single section (3 sections per fish). An unpaired, two-sided Student’s t-test was used to assess statistical differences between exercised and unexercised nr2f1aaco fish. Comparison marked **p = 0.0028. All error bars represent the mean +/− SEM. Source data are provided as a Source Data file.

The remodeled nr2f1a mutant SV acquires characteristics of the arterial BA.

a Schematic depicting the dissection of individual cardiac chambers for single cell RNA-seq analysis. b Uniform Manifold Approximation and Projection (UMAP) plot showing the 15 ICGS2 clusters corresponding to smooth muscle, endothelial, and epithelial cells. asm – arterial smooth muscle, vsm – venous smooth muscle, psml – pan-smooth muscle-like, vlec – venous-lymphatic endothelial cell, aec – arterial endothelial cell, ecp – endothelial cell progenitor, epi – epithelial cell. c The UMAP plot shows the contributions of cells from each the WT BA, WT SV, nr2f1aaco mutant BA, and nr2f1aaco mutant SV. Dashed outlines indicate cells from clusters 1, 7, and 10 (SMCs) and clusters 9 and 10 (ECs) occupying similar space that are from the WT BA, WT SV, and nr2f1aaco mutant SV. d Dot matrix plot comparing the expression of selected SMC and ECs marker genes within clusters 1–13. e Gene-enrichment (GO-Elite) of WT cluster marker genes compared to previously published arterial, venous, and intermediate vascular populations. f GO enrichment of marker genes from nr2f1aaco mutant C6 vs WT C6 SMC populations. Gene-set enrichment analysis is performed using GO-Elite. A Z-score and Fisher’s Exact two-sided Test p-value are calculated to assess over-representation of Ontology terms, gene-sets, and pathways. Adjusted p-values (FDR p-values) for these various tests are calculated using the Benjamini-Hochberg correction method. g Frequency of cells from clusters in the nr2f1aaco mutant and WT SV. h Frequency of cells from clusters in the nr2f1aaco mutant and WT BA. i Pseudotime analysis was performed with Monocle2 mapping cellular identities from the SMC clusters (1–8). j Individual 10x Genomics captures showing separated populations from (i). Dashed outline indicates nr2f1aaco mutant SV cells occupying trajectories that are normally found almost exclusively in the WT and nr2f1aaco mutant BA.

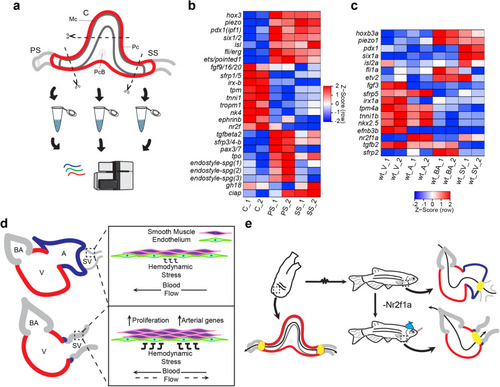
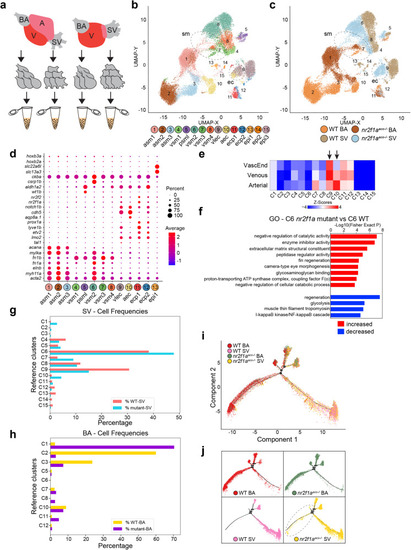
Blood sinuses of the tunicate heart have conserved expression of genes found in the teleost BA and SV.

a Schematic summarizing the regions of the adult Ciona heart that were harvested for bulk RNA-seq. Pharyngeal blood sinus (PS), stomach blood sinus (SS), and cardiac tube (C). Mc – myocardial tissue (dark gray), Pc – pericardium (red), PcB – pericardial body. b Heatmap showing the expression of representative genes found in the C, PS, and SS of the adult Ciona heart. c Heatmap showing the expression of homologous genes to those in Ciona found in the V, A, BA, and SV of WT adult zebrafish hearts. d Summary depicting the adaptive response whereby the SV thickens due to proliferation from SMCs in nr2f1aaco mutants. e Evolutionary model depicting the heart of the Ciona with bi-direction flow and the adaptive response in nr2f1aaco mutants to regurgitation whereby the heart comes to resemble characteristics of the Ciona heart with equivalency in the sinuses at the arterial and venous poles.

Acknowledgments
This image is the copyrighted work of the attributed author or publisher, and ZFIN has permission only to display this image to its users. Additional permissions should be obtained from the applicable author or publisher of the image. Full text @ Nat. Commun.