|
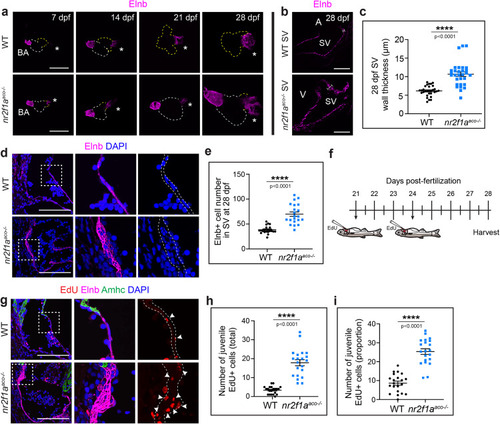
Nr2f1a mutant SV undergoes adaptive remodeling via proliferation of smooth muscle cells. a Confocal images of Elnb IHC in whole hearts from WT and nr2f1aaco fish at weekly intervals through 28 dpf. Venous pole (asterisks). Dashed lines outline the myocardium (white - ventricle, yellow - atrium). WT 21 dpf and 28 dpf images just show the atrium and venous pole. Scale bars – 200 μm. b Confocal images of IHC for Elnb on mid-sagittal sections showing the SV at 28 dpf. Bars indicate thickness. Scale bars − 100 μm. c Quantification of SV wall thickness (µm) in sections (n = 10 fish). Individual points on the graphs represent a single section averaged from 10 measurements from a single section (3 total sections per fish). 3 adjacent sections were analyzed per fish. d Confocal images of IHC for Elnb (magenta) and DAPI (blue) staining on sagittal sections showing the SV at 28 dpf. DAPI+ nuclei within the Elnb staining of the whole sections were counted. Boxes show the regions of the higher magnification. Dashed outline indicates the Elnb+ region. Scale bars – 50 μm. e Quantification of Elnb-surrounded cells (DAPI+ nuclei) within sections of the SV (n = 7 fish per group). 3 adjacent sections were quantified per fish. f Schematic of EdU labeling with intrathoracic injections in juvenile zebrafish. g Confocal images of sagittal sections from juvenile WT and nr2f1aaco mutant fish showing the SV following detection of EdU (red) incorporation. Boxes indicate regions of higher magnification. Dashed outline indicates DAPI+ nuclei (blue) within the Elnb+ (magenta) tissue. Amhc (green) was used as control to mark the border of the SV. White arrowheads indicate EdU+ nuclei embedded in the Elnb+ tissue of the SV. Scale bars – 50 μm. h, i Quantification of a total number of Elnb-surrounded EdU+ nuclei and the proportion of Elnb-surrounded EdU+ to total (DAPI+) nuclei within sections SV (n = 7 fish per group). Individual points represent 1 section with 3 sections counted per fish. An unpaired, two-sided Student’s t-test was used to assess statistical differences between WT and nr2f1aaco in all graphs. Comparisons marked ****p < 0.0001. Error bars represent the mean +/− SEM. Source data are provided as a Source Data file.
|