|
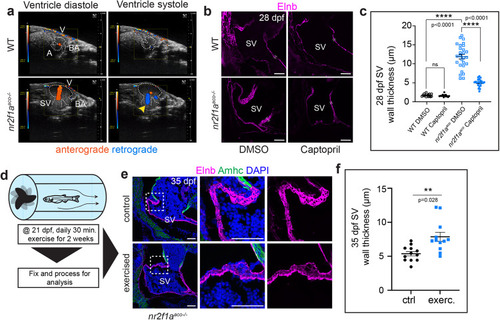
Aberrant blood flow contributes to remodeling in nr2f1a mutant hearts. a Ultrasound images from echocardiography were conducted on adult WT and nr2f1aaco mutant fish. Anterior is to the right and ventral is up. Flow direction was pseudo-colored for ease of clearly discerning anterograde ventricular inflow (orange) and retrograde outflow (blue). Dashed lines denote the borders of heart. Yellow arrowhead indicates the location of regurgitation in nr2f1aaco mutant heart. Still images were isolated from Supplementary Movies 1 and 2. n = 3 WT and nr2f1aaco mutant fish were examined. b Confocal images of sagittal sections from 28 dpf WT and nr2f1aaco mutant fish treated with either Captopril or DMSO (control). Scale bars – 100 μm. c Quantification of Elnb+ wall thickness (µm) at 28 dpf following Captopril treatments began at 14 dpf. Individual points on the graphs represent 10 measurements averaged from different regions of the SV in a single section (3 total sections per fish). (n = 5 for WT control and treated groups, n = 9 for nr2f1aaco control group, n = 7 for nr2f1aaco treated group). Statistical significance was calculated using an ordinary one-way ANOVA with multiple comparisons. Comparisons marked ****p < 0.0001. Source data are provided as a Source Data file. d Schematic outlining the juvenile exercise regimen beginning at 21 dpf. e Confocal images of sagittal sections showing immunostaining detecting Elnb (magenta), Amhc (green), and DAPI+ nuclei (blue) in the SV of unexercised (control) and exercised nr2f1aaco mutant fish following 2 weeks of daily exercise. Scale bars − 50 μm. f Quantification of Elnb+ wall thickness at 35 dpf following 2 weeks of daily exercise (n = 4 fish per group). Individual points on the graphs represent 20 measurements averaged from different regions of the SV in a single section (3 sections per fish). An unpaired, two-sided Student’s t-test was used to assess statistical differences between exercised and unexercised nr2f1aaco fish. Comparison marked **p = 0.0028. All error bars represent the mean +/− SEM. Source data are provided as a Source Data file.
|