|
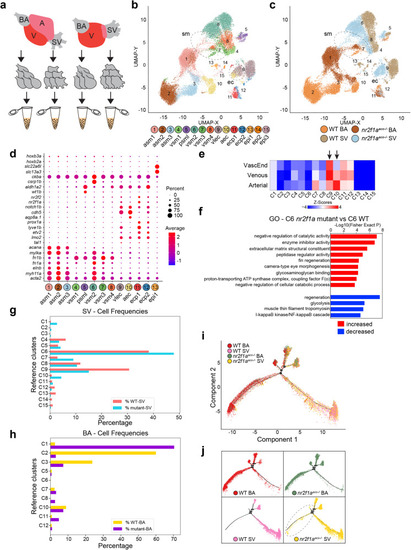
The remodeled nr2f1a mutant SV acquires characteristics of the arterial BA. a Schematic depicting the dissection of individual cardiac chambers for single cell RNA-seq analysis. b Uniform Manifold Approximation and Projection (UMAP) plot showing the 15 ICGS2 clusters corresponding to smooth muscle, endothelial, and epithelial cells. asm – arterial smooth muscle, vsm – venous smooth muscle, psml – pan-smooth muscle-like, vlec – venous-lymphatic endothelial cell, aec – arterial endothelial cell, ecp – endothelial cell progenitor, epi – epithelial cell. c The UMAP plot shows the contributions of cells from each the WT BA, WT SV, nr2f1aaco mutant BA, and nr2f1aaco mutant SV. Dashed outlines indicate cells from clusters 1, 7, and 10 (SMCs) and clusters 9 and 10 (ECs) occupying similar space that are from the WT BA, WT SV, and nr2f1aaco mutant SV. d Dot matrix plot comparing the expression of selected SMC and ECs marker genes within clusters 1–13. e Gene-enrichment (GO-Elite) of WT cluster marker genes compared to previously published arterial, venous, and intermediate vascular populations. f GO enrichment of marker genes from nr2f1aaco mutant C6 vs WT C6 SMC populations. Gene-set enrichment analysis is performed using GO-Elite. A Z-score and Fisher’s Exact two-sided Test p-value are calculated to assess over-representation of Ontology terms, gene-sets, and pathways. Adjusted p-values (FDR p-values) for these various tests are calculated using the Benjamini-Hochberg correction method. g Frequency of cells from clusters in the nr2f1aaco mutant and WT SV. h Frequency of cells from clusters in the nr2f1aaco mutant and WT BA. i Pseudotime analysis was performed with Monocle2 mapping cellular identities from the SMC clusters (1–8). j Individual 10x Genomics captures showing separated populations from (i). Dashed outline indicates nr2f1aaco mutant SV cells occupying trajectories that are normally found almost exclusively in the WT and nr2f1aaco mutant BA.
|