FIGURE SUMMARY
Title

Long wavelength-sensing cones of zebrafish retina exhibit multiple layers of transcriptional heterogeneity

Authors
Farre, A.A., Sun, C., Starostik, M.R., Hunter, S.S., English, M.A., Duncan, A., Santhanam, A., Shihabeddin, E., O'Brien, J., Swaroop, A., Stenkamp, D.L.
Source
Full text @ Front. Cell. Neurosci.

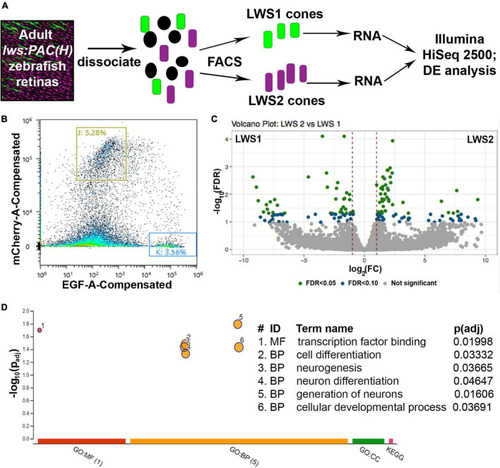
Comparative transcriptome analysis of LWS1 vs. LWS2 cones using FACS followed by bulk RNA-Seq. (A) Schematic of dissociation and sequencing workflow. (B) Representative (100,000 sorted events) sorting report for an lws:PAC(H) sample used in the study; red fluorescence intensity vs. green fluorescence intensity. Gating strategy (boxes labeled J and K) for this sort resulted in the sorting percentages of events indicated. (C) Volcano plot depicting transcripts differentially expressed (DE) in LWS1 (left side) vs. LWS2 (right side) cones. Green symbols, transcripts DE at FDR < 0.05; blue symbols, transcripts DE at FDR < 1.0. (D) Gene ontology (GO) analysis depicting GO categories overrepresented in the list of DE genes enriched in LWS1 (vs. LWS2) cones. MF, molecular function; BP, biological process.

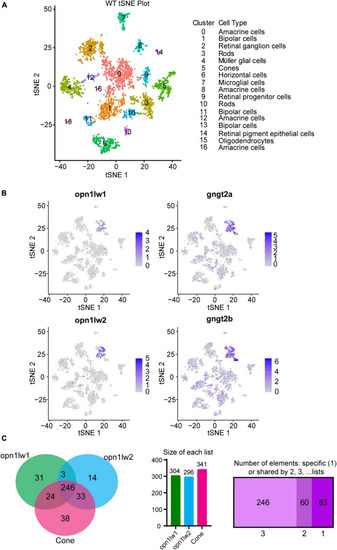
Single cell RNA-Seq and interrogation for transcripts enriched in LWS1 vs. LWS2 cones. (A) Visualization of scRNA-Seq output using t-distributed stochastic neighbor embedding (TSNE) plots. Colors of plotted symbols correspond to retinal cell types as predicted by gene expression. (B) Expression of lws1 (opn1lw1), lws2 (opnlw2), gngt2a, and gngt2b predominantly within the cone cluster of the TSNE plot. There is very little coincidence in lws1 vs. lws2 expression in individual cones, but greater coincidence for gngt2a and gngt2b. (C) Venn diagram of genes specifically expressed by LWS1 cones, LWS2 cones, and the overall cone population. scRNA-Seq was able to identify transcripts unique to each LWS cone subtype as well as those common to both. Individual lists of transcripts within each space of the Venn diagram are provided as Dataset 4.

Expression of gngt2a in adult wildtype zebrafish retina using multiplex fluorescence in situ hybridization chain reaction (HCR). (A) Expression of lws1 (magenta) and lws2 (cyan) in a representative whole retina (D, dorsal). (A’) Expression of gngt2a (yellow) in the same preparation, showing that signal intensity appears greatest in the lws1-expressing domain, but signal is not confined to this domain. (A”)gngt2a and lws1. (A”’)gngt2a and lws2. (B) 40x image of lws1 and lws2 expression in a region of transition from lws1 to lws2. (B’) 40x image of gngt2a expression in the same region, indicating gngt2a is not restricted to lws1-expressing cones, nor to LWS cones in general. (C) Selected enlarged region of (A”) showing gngt2a and lws1. (D) Same region showing gngt2a and lws2. (D–D”’) Resliced orthogonal projections of (B). (D) All imaging channels merged. (D’) DAPI and gngt2a.(D”) DAPI and lws1. (D”’) DAPI and lws2. gngt2a is co-expressed by lws1 + and lws2 + cones, as well as in non-LWS cones. Sample size = 2.

Expression of gngt2b in adult wildtype zebrafish retina using HCR. (A) Expression of lws1 (magenta) and lws2 (cyan) in a representative whole retina. (A’) Expression of gngt2b (yellow) in the same preparation, showing that signal intensity appears greatest in the lws2-expressing domain. (A”)gngt2b and lws1. (A”’)gngt2b and lws2. (B) 40x image of lws1, lws2, and gngt2b expression in a region of transition from lws1 to lws2, indicating gngt2b and lws2 co-expression, and gngt2b expression in other populations of photoreceptors. (B’) 40x image of gngt2b expression, highlighting distinct subcellular expression domains of gngt2b. (C) Selected enlarged region (transition zone) of (A”) - gngt2b and lws1. (D) Same region showing gngt2b and lws2. (D–D”’) Resliced orthogonal projections of panel (B). (D) All imaging channels merged. (D’) DAPI and gngt2b.(D”) DAPI and lws1. (D”’) DAPI and lws2. D, dorsal. Samples size = 2.

Expression of nrip1a and nr2f2 in adult zebrafish retina. (A–C”’)nrip1a. (D–F”’)nr2f2. (A) Expression of lws1 (magenta) and lws2 (cyan) in a representative whole retina. (A’)nrip1a expression (yellow) in the same preparation, showing pan-retinal expression. (B) 40x image of lws1, lws2, and nrip1a expression in a region of lws1 to lws2 transition. (B’)nrip1a alone, in same region. C-C”’) Resliced orthogonal projection of panel (B). (C) All imaging channels merged. (C’) DAPI and nrip1a. (C”) DAPI and lws1.(C”’) DAPI and lws2.(D) Expression of lws1 (magenta) and lws2 (cyan) in a representative whole retina. D’) nr2f2 expression (yellow), showing slight bias in signal intensity toward dorsal retina. (E) 40x image of lws1, lws2, and nr2f2 expression in a region of lws1 to lws2 transition, at the level of cone inner segments. Scale same as in panel (B). (E’)nr2f2 alone, in the same region, at the level of the deep INL. (F–F”’) Resliced orthogonal projection of panels (E,F) All imaging channels merged. (F’) DAPI and nr2f2. (F”) DAPI and lws1.(F”’) DAPI and lws2. D, dorsal. Sample size = 2.

Expression of vax1 and vax2 in adult zebrafish retina. (A–C”’)vax1. (D–F”’)vax2. (A) Expression of lws1 (magenta) and lws2 (cyan) in a representative whole retina. (A’)vax1 expression (yellow) in the same preparation, showing expression restricted to the lws1-expressing domain. (B) 40x image of lws1, lws2, and vax1 expression, in a region of lws1 to lws2 transition; orientation of panels (B,B’) are such that dorsal is to the right. (B’) 40x image of vax1 alone, showing transition to vax1 domain is less abrupt than the transition to the lws1 domain. (C–C”’) Resliced orthogonal projections of panel (B). (C) All imaging channels merged. (C’) DAPI and vax1. (C”) DAPI and lws1.(C”’) DAPI and lws2.(D) Expression of lws1 (magenta) and lws2 (cyan) in a representative whole retina. (D’)vax2 expression (yellow) in the same preparation, showing expression restricted to the lws1-expressing domain. (E) 40x image of lws1, lws2, and vax2 expression, in a region of lws1 to lws2 transition. (E’) 40x image of vax2 alone in the same region, showing transition to vax1 domain is less abrupt than the transition to the lws1 domain. (F–F”’) Resliced orthogonal projections of panel (E). (F) All imaging channels merged. (F’) DAPI and nr2f2. (F”) DAPI and lws1.(F”’) DAPI and lws2. D, dorsal. Sample size = 2.

Expression of si:busm1 in adult zebrafish retina. (A) Expression of lws1 (magenta) and lws2 (cyan) in a representative whole retina. (A’)si:busm1 expression (yellow) in the same preparation showing pan-retinal expression. (B) 40x image of lws1, lws2, and si:busm1 expression in a region of lws1 to lws2 transition. (B’) 40x image of si:busm1 alone. Inset continues the field of view but at the level of the boundary between the inner nuclear layer and inner plexiform layer. (C–C”’) Resliced orthogonal projections of panel (B). (C) All imaging channels merged. (C’) DAPI and si:busm1. (C”) DAPI and lws1.(C”’) DAPI and lws2. D, dorsal. Sample size = 2.

Expression of gngt2a in control (DMSO) and TH-treated (T3) larval zebrafish. (A–D) Projections of representative whole, imaged eyes. Note reduced expression domain of lws2 (cyan), and expanded expression domains of lws1 (magenta) and gngt2a (yellow) in T3-treated (B,D) vs. controls (A,C); expanded domains do not appear to align, however, (E–F’) Single z slices obtained from the same preparations. (G–G”’) Enlarged images of region within box in pane (F). (G) All imaging channels merged. (G’)gngt2a. (G”)lws1.(G”’)lws2.(H) qPCR quantification of gngt2a transcript abundance in pooled samples of whole larvae, n = 5 biological replicates per condition, p = 0.0967. (I) 3D fluorescence intensity quantification, n = 3 embryos per condition. (J) percent of eyes with expression of gngt2a in dorsal retina, n = 7 (DMSO), 5 (T3), p = 0.013. (proportion test). D, dorsal; T, temporal. *, p < 0.05; n.s., not significant.

Expression of gngt2b in control (DMSO) and TH-treated (T3) larval zebrafish. (A–D) Projections of representative whole, imaged eyes. Note reduced expression domain of lws2 (cyan), and expanded expression domains of lws1 (magenta) in T3-treated (B,D) vs. controls (A,C); the gngt2b (yellow) expression domain did not appear to change. (E–F’) Single z slices obtained from the same preparations. (G–G”’) Enlarged images of region within box in panel (F). (G) All imaging channels merged. (G’)gngt2b(G”)lws2(G”’)lws1(H) qPCR quantification of gngt2b transcript abundance in pooled samples of whole larvae, n = 6 biological replicates per condition, p = 3.159E-05. (I) 3D fluorescence intensity quantification, n = 3 embryos (DMSO), 4 (T3). D, dorsal; T, temporal. ***, p < 0.001; *, p < 0.05.

Expression of nr2f2 and nrip1a in larval zebrafish. (A–H)nrip1a. (I–P)nr2f2. (A–D,I–L) Projections of representative whole, imaged eyes. (E–F’,M–N’) Single z slices obtained from the same preparations. Note reduced expression domain of lws2 (cyan), and expanded expression domains of lws1 (magenta) in T3-treated (B,D,J,L) vs. controls (A,C,I,K); the nrip1a (yellow, A–D) expression domain did not appear to change; the nr2f2 (yellow, I–L) expression domain did not appear to change, however, there appears to be slightly greater expression in the dorsal portion of the retina (E,F) All imaging channels merged. (E’,F’)nrip1a(M,N) All imaging channels merged. (M’,N’)nr2f2(G) qPCR quantification of nrip1a transcript abundance in pooled samples of whole larvae, n = 5 biological replicates per condition, p = 0.476. (H) 3D fluorescence intensity quantification for nrip1a, n = 5 embryos (DMSO), 3 (T3), sample size too small for Mann–Whitney test. (O) qPCR quantification of nr2f2 transcript abundance in pooled samples of whole larvae, n = 5 biological replicates per condition, p = 0.00152 (P) 3D fluorescence intensity quantification of nr2f2, n = 3 embryos per condition, p = 0.014 (t-test). D, dorsal, T, temporal. *, p < 0.05; **, p < 0.01; n.s., not significant.

Expression of vax1 and vax2 in larval zebrafish. (A–G)vax1. (H–N)nrip1a. (A–D,H–K) Projections of representative whole, imaged eyes. (E–F”,L–M”) Single z slices obtained from the same preparations. Note reduced expression domain of lws2 (cyan), and expanded expression domains of lws1 (magenta) in T3-treated (B,D,I,K) vs. controls (A,C,H,J); the vax1 (yellow, A–D) and vax2 (yellow, H–K) expression domain did not appear to change. (E’–F”) Enlarged images of regions within box of panels (E,F, respectively). (E’,F’) All imaging channels merged. (E”,F”)vax1(L’–M”) Enlarged images of regions within box of panels (L,M, respectively). (L’,M’) All imaging channels merged. (L”,M”)vax2(G) qPCR quantification of vax1 transcript abundance in pooled samples of whole larvae, n = 4 biological replicates per condition, p = 0.123. (N) qPCR quantification of vax2 transcript abundance in pooled samples of whole larvae, n = 5 biological replicates per condition, p = 0.312. n.s., not significant.

Expression of si:busm1 in larval zebrafish. (A–D) Projections of representative whole, imaged eyes. (E–F”’) Single z slices obtained from the same preparations. Note reduced expression domain of lws2 (cyan), and expanded expression domains of lws1 (magenta) in T3-treated (B,D) vs. controls (A,C); the si:busm1 (yellow) expression domain appears greatly reduced in the treated condition (D). (E’–E”’) Enlarged images of region within box in panel (E). (E’) All imaging channels merged. (E”)si:busm1(E”’)lws2(E””)lws1(F’–F””) Enlarged images of region within box in panel (F). (F’) All imaging channels merged. (F”)si:busm1(F”’)lws2(F””)lws1(G–J) Projections of whole embryo heads. (K) qPCR quantification of gngt2a transcript abundance in pooled samples of whole larvae, n = 5 biological replicates, p = 0.244. (L) 3D fluorescence intensity quantification, n = 5 (DMSO), 4 (T3), p = 0.056 (t-test). D, dorsal, T, temporal. n.s., not significant.

Acknowledgments
This image is the copyrighted work of the attributed author or publisher, and ZFIN has permission only to display this image to its users. Additional permissions should be obtained from the applicable author or publisher of the image. Full text @ Front. Cell. Neurosci.