IMAGE

FIGURE 2

ID
ZDB-IMAGE-230731-150
Source
Figures for Farre et al., 2023
Image
Figure Caption

FIGURE 2

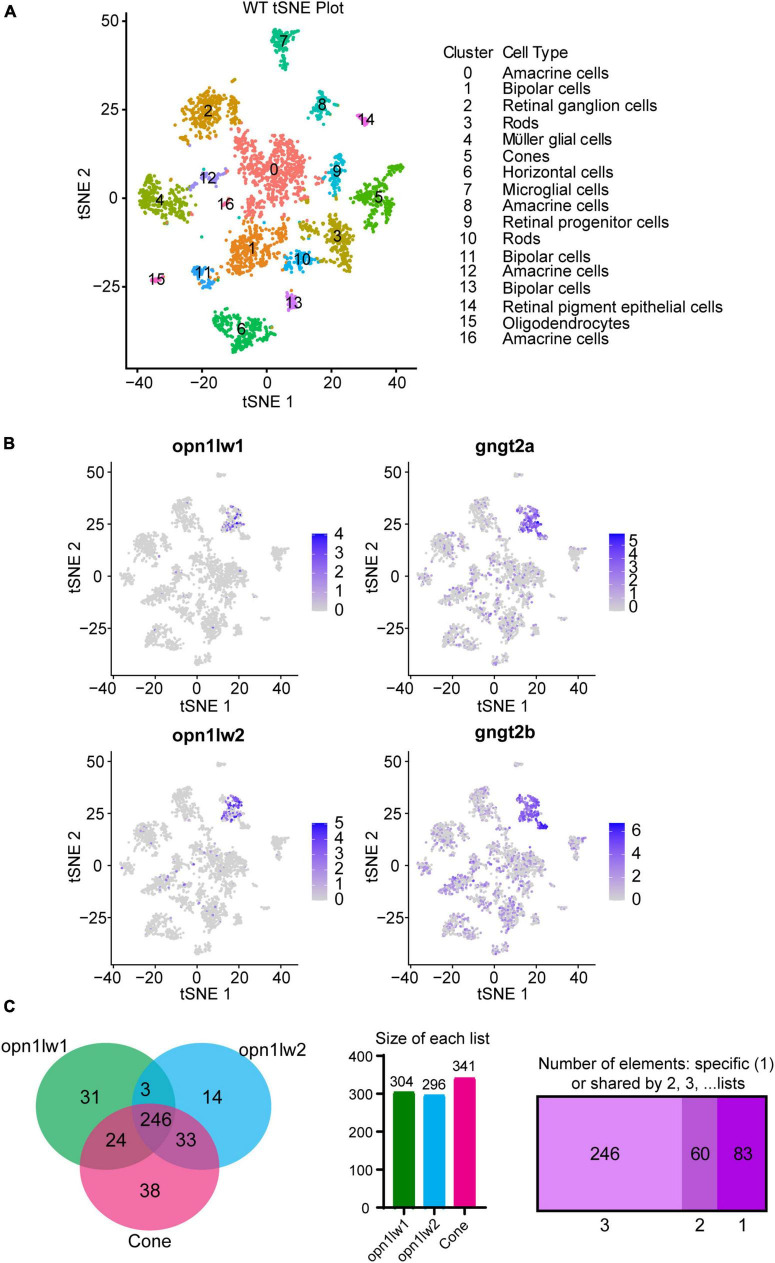
Single cell RNA-Seq and interrogation for transcripts enriched in LWS1 vs. LWS2 cones. (A) Visualization of scRNA-Seq output using t-distributed stochastic neighbor embedding (TSNE) plots. Colors of plotted symbols correspond to retinal cell types as predicted by gene expression. (B) Expression of lws1 (opn1lw1), lws2 (opnlw2), gngt2a, and gngt2b predominantly within the cone cluster of the TSNE plot. There is very little coincidence in lws1 vs. lws2 expression in individual cones, but greater coincidence for gngt2a and gngt2b. (C) Venn diagram of genes specifically expressed by LWS1 cones, LWS2 cones, and the overall cone population. scRNA-Seq was able to identify transcripts unique to each LWS cone subtype as well as those common to both. Individual lists of transcripts within each space of the Venn diagram are provided as Dataset 4.

Acknowledgments
This image is the copyrighted work of the attributed author or publisher, and ZFIN has permission only to display this image to its users. Additional permissions should be obtained from the applicable author or publisher of the image. Full text @ Front. Cell. Neurosci.