FIGURE

FIGURE 1

ID
ZDB-FIG-230731-150
Publication
Farre et al., 2023 - Long wavelength-sensing cones of zebrafish retina exhibit multiple layers of transcriptional heterogeneity
Other Figures
All Figure Page
Back to All Figure Page
FIGURE 1

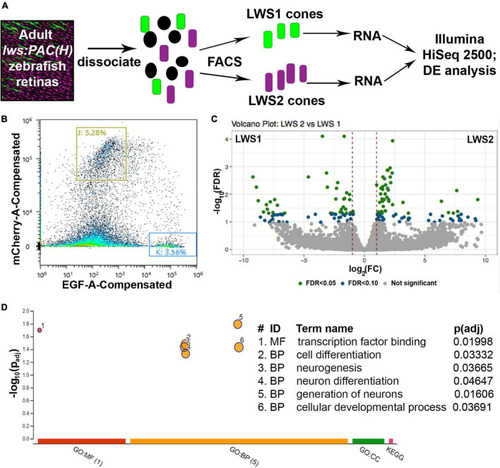
Comparative transcriptome analysis of LWS1 vs. LWS2 cones using FACS followed by bulk RNA-Seq. (A) Schematic of dissociation and sequencing workflow. (B) Representative (100,000 sorted events) sorting report for an lws:PAC(H) sample used in the study; red fluorescence intensity vs. green fluorescence intensity. Gating strategy (boxes labeled J and K) for this sort resulted in the sorting percentages of events indicated. (C) Volcano plot depicting transcripts differentially expressed (DE) in LWS1 (left side) vs. LWS2 (right side) cones. Green symbols, transcripts DE at FDR < 0.05; blue symbols, transcripts DE at FDR < 1.0. (D) Gene ontology (GO) analysis depicting GO categories overrepresented in the list of DE genes enriched in LWS1 (vs. LWS2) cones. MF, molecular function; BP, biological process.

Expression Data

Expression Detail
Antibody Labeling
Phenotype Data

Phenotype Detail
Acknowledgments
This image is the copyrighted work of the attributed author or publisher, and ZFIN has permission only to display this image to its users. Additional permissions should be obtained from the applicable author or publisher of the image. Full text @ Front. Cell. Neurosci.