
- Title
-
Transcription factor induction of vascular blood stem cell niches in vivo
- Authors
- Hagedorn, E.J., Perlin, J.R., Freeman, R.J., Wattrus, S.J., Han, T., Mao, C., Kim, J.W., Fernández-Maestre, I., Daily, M.L., D'Amato, C., Fairchild, M.J., Riquelme, R., Li, B., Ragoonanan, D.A.V.E., Enkhbayar, K., Henault, E.L., Wang, H.G., Redfield, S.E., Collins, S.H., Lichtig, A., Yang, S., Zhou, Y., Kunar, B., Gomez-Salinero, J.M., Dinh, T.T., Pan, J., Holler, K., Feldman, H.A., Butcher, E.C., van Oudenaarden, A., Rafii, S., Junker, J.P., Zon, L.I.
- Source
- Full text @ Dev. Cell
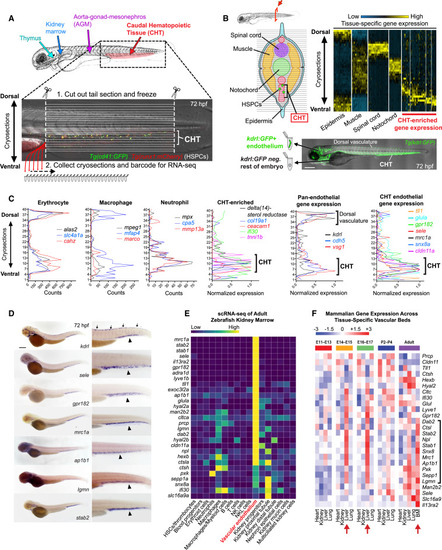
An endothelial gene expression signature unique to HSPC niches (A) Schematic diagram illustrates the hematopoietic tissues of the zebrafish embryo (top) and the sectioning strategy used to perform RNA tomography (tomo-seq) on the CHT (bottom; double transgenic embryo carrying the HSPC markers cd41:GFP and runx1:mCherry is shown). (B) Cross-section schematic (upper left) and hierarchical clustering heatmap (upper right) reveal clusters of gene expression that correspond to distinct tissues along the dorsal-ventral axis of the zebrafish tail. Schematic at bottom depicts strategy using kdrl:GFP transgenic embryos and FACS to isolate ECs from whole embryos for analysis by RNA-seq. (C) Graphs show tomo-seq expression traces for individual tissue-specific genes. (D) Images show whole-mount in situ hybridization (WISH) for the pan-endothelial gene kdrl (top panel) and CHT EC-enriched genes identified by tomo-seq and tissue-specific RNA-seq (bottom panels). Arrows point to expression in dorsal vasculature and arrowheads point to expression in the CHT. (E) Heatmap shows the expression of the 29 CHT EC genes in the different cell populations that comprise the adult zebrafish kidney marrow. Spectral scale reports normalized expression. (F) Heatmap shows the expression of orthologs of the zebrafish CHT EC genes in ECs from different organs of the mouse at different stages of development and postnatal transition to adulthood. Red arrows denote hematopoietic tissues at the respective stage of development. Black bracket denotes genes enriched in fetal liver ECs at the E14–17 stages and then later in the adult bone marrow. Spectral scales report Z scores. BM, bone marrow. Scale bars represent 250 μm in this and all subsequent figures unless noted otherwise. |
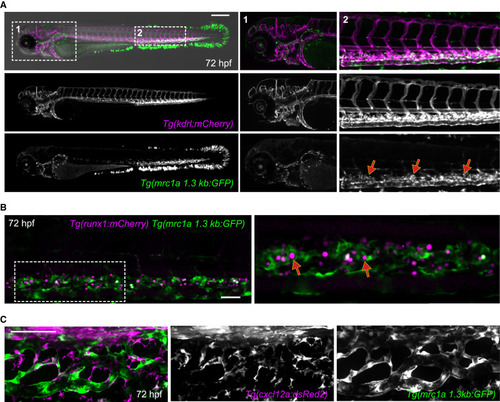
Niche endothelial-enriched mrc1a 1.3kb:GFP expression (A) Images show a double transgenic embryo carrying the pan-endothelial marker kdrl:mCherry (magenta) and the mrc1a 1.3kb:GFP transgene (green). Magnifications of boxed areas are shown on the right. The highest levels of vascular GFP expression are observed in CHT ECs (red arrows), whereas lower levels of expression are observed in the anterior head region, although some of these cells do not express the kdrl:mCherry transgene. (B) Images show runx1:mCherry+ HSPCs (magenta) directly interacting with mrc1a 1.3kb:GFP+ ECs within the CHT niche (red arrows). Panel on right shows magnification of boxed area. (C) cxcl12a:dsRed2+ stromal cells (magenta) are closely associated with mrc1a 1.3kb:GFP+ ECs in the CHT. Scale bars in (B) and (C) represent 100 μm. |

CHT- and pan-endothelial-specific regulatory elements (A) Image and schematic depict the four cell populations that were isolated from mrc1a 1.3kb:GFP+; kdrl:mCherry+ double-positive embryos for analysis by ATAC-seq. (B) Gene tracks show regions of chromatin that were uniquely open in the GFP+mCherry+ CHT EC fraction. Images on the right show embryos injected with a CHT EC enhancer-GFP reporter construct corresponding to the red boxed region (red arrow). Arrowheads points to GFP expression in CHT ECs. (C) Gene tracks show regions of chromatin that were open in both the mCherry+GFP+ (CHT EC) and mCherry+GFP− (non-CHT EC) populations (red boxes and arrows). Images on the right show embryos injected with pan-endothelial enhancer-GFP reporter constructs corresponding to the red boxed regions. Arrows point to GFP expression in non-CHT ECs and arrowheads point to expression in CHT ECs. (D) Images show reporter expression of stable enhancer-GFP transgenes. Arrows point to GFP expression in non-CHT ECs and arrowheads point to expression in CHT ECs. |
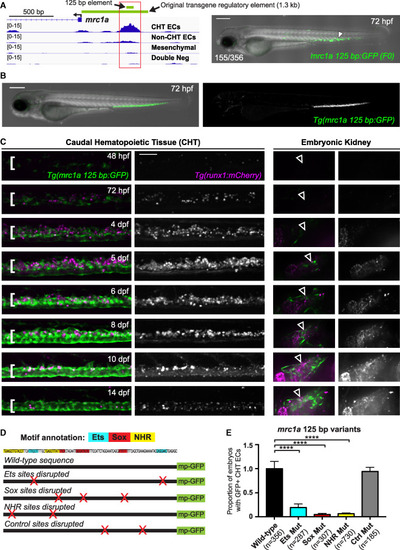
CHT endothelial specific enhancer mutagenesis (A) Gene tracks show a region of chromatin (red box) upstream of mrc1a that is uniquely open in the double-positive CHT EC fraction but not the other three cell populations. Green bars denote the position of the 125 bp enhancer sequence and the 1.3 kb sequence used to generate the reporter transgenes. Image on the right shows transient GFP expression in an F0 embryo injected with the 125 bp enhancer sequence coupled to a minimal promoter and GFP. (B) Images show an embryo expressing the stably integrated mrc1a 125 bp:GFP transgene. (C) Images show mrc1a 125bp:GFP (green) and runx1:mCherry (magenta) expression in the CHT (left) and kidney (right) at 8 different developmental time points. White brackets denote the location of the CHT and arrowheads point to the location of the developing kidney. Grayscale images of the runx1:mCherry signal are shown to the right of color overlays. Identical settings were used for image acquisition at each time point. The fluorescence intensity for the images in the figure was adjusted relative to the highest expression at 8 dpf. This results in the reduced fluorescence intensity in the image for the 48 hpf time point. (D) Wild-type sequence of the 125 bp mrc1a enhancer is shown, annotated with colors highlighting the Ets, Sox, and NHR binding motifs. Schematic depicts enhancer-reporter constructs in which each class of motif or control regions was targeted by mutation. Red X’s denote the location of targeted sites. mp-GFP, mouse Beta-globin minimal promoter fused to GFP. (E) Graphs report the frequency of embryos with GFP expression in CHT ECs after injection with wild-type sequences or mutated variants of the mrc1a 125 bp enhancer. Data is normalized to the wild-type control (44% [155/356]). Mean ± SEM, one-way ANOVA with Dunnett’s multiple comparisons test; ∗∗∗p < 0.001, ∗∗∗∗p < 0.0001. All experiments were performed at least three times, with independent clutches. Scale bar in (C) represents 100 μm. |

7-factor induction of ectopic niche EC gene expression (A) Schematic depicts the strategy used in transcription factor overexpression experiments. (B and C) Images show embryos that were injected with control DNA (left) or a pool of seven transcription factors (right) from the Ets, Sox, and NHR families (FLI1, ETV2, ETS1, SOX7, Sox18, Nr2f2, and RXRA) and then stained by WISH for mrc1a (B) or sele (C). Red arrows denote regions of ectopic expression and black arrowheads point to normal domains of expression in all panels of this figure. (D) Images show mrc1a 1.3kb:GFP; kdrl:mCherry double transgenic embryos that were injected with control DNA (left) or a pool of seven transcription factors (right). (E) Images show ectopic expression of the mrc1a 1.3kb:GFP and kdrl:mCherry transgenes over the yolk extension in a 7-factor injected embryo. Magnification of the boxed area is shown at the right. Control and experimental groups were blinded prior to scoring and all experiments were performed at least three times, with independent clutches. Scale bars in (D) and (E) represent 100 μm. |

3-factor induction of ectopic niche EC gene expression (A) Images show WISH for mrc1a in a control embryo (top) or after injection of a 3-factor pool containing ETV2, SOX7 and Nr2f2 (middle) or ETS1, SOX7, and Nr2f2 (bottom). Black arrowheads point to endogenous expression while red arrows point to ectopic expression in all panels of this figure. (B) Graph reports quantification of the percentage of injected embryos that displayed ectopic mrc1a WISH staining after transcription factor overexpression. Chi-squared test and Fisher’s exact test for pairwise comparisons with the Holm step-down process to correct for multiple comparisons; ∗∗∗p < 0.001, ∗∗∗∗p < 0.0001. (C) Images show WISH for CHT niche EC genes in control embryos (left) and embryos injected with the 3-factor ubi:ETV2, SOX7, and Nr2f2 combination (right). (D) Images show ectopic GFP expression in vessels in the anterior head and yolk region of mrc1a 125bp:GFP transgenic embryos injected with the 3-factor ubi:ETV2, SOX7, and Nr2f2 mixtures. (E) Images show ectopic expression in mrc1a 125bp:GFP; kdrl:mCherry double-positive embryos that were injected with muscle-specific mylz2:ETV2, SOX7, Nr2f2 (left), or endothelial-specific nrp1b:ETV2, SOX7, and Nr2f2 (right) plasmids. Magnification of boxed regions is shown at the bottom. Control and experimental groups were blinded prior to scoring and all experiments were performed at least three times, with independent clutches. Scale bars in (C) and (E) represent 100 μm. |

Ectopic vascular regions recruit HSPCs and support their proliferation (A) WISH for runx1 shows HSPC localization in a control (left) and 3-factor injected embryo (right). Black arrowheads denote endogenous CHT localization; and red arrows point to ectopic localization. (B) Image shows runx1:mCherry+ HSPCs localized outside the CHT within a large ectopic region of mrc1a 1.3kb:GFP expression in an embryo injected with a pool of ubi:ETV2, SOX7, and Nr2f2. Magnification of boxed area is shown on the right. (C) ECs ectopically expressing mrc1a 1.3kb:GFP are associated with cxcl12a:dsRed2+ stromal cells, similar to ECs in the CHT. Asterisk denotes notochord expression of cxcl12a:dsRed2, and the black arrowhead points to CHT localization. Magnification of boxed region is shown. (D) Time-lapse series shows a runx1:mCherry+ HSPC (red arrows) initially arriving at an ectopic site and subsequently dividing (images show magnification of region with red arrow in Video S8). Time is shown as hh:mm. Control and experimental groups were blinded prior to scoring and all experiments were performed at least three times, with independent clutches. Scale bars represent 100 μm in (A-C), and 30 μm in (D). |
Reprinted from Developmental Cell, 58(12), Hagedorn, E.J., Perlin, J.R., Freeman, R.J., Wattrus, S.J., Han, T., Mao, C., Kim, J.W., Fernández-Maestre, I., Daily, M.L., D'Amato, C., Fairchild, M.J., Riquelme, R., Li, B., Ragoonanan, D.A.V.E., Enkhbayar, K., Henault, E.L., Wang, H.G., Redfield, S.E., Collins, S.H., Lichtig, A., Yang, S., Zhou, Y., Kunar, B., Gomez-Salinero, J.M., Dinh, T.T., Pan, J., Holler, K., Feldman, H.A., Butcher, E.C., van Oudenaarden, A., Rafii, S., Junker, J.P., Zon, L.I., Transcription factor induction of vascular blood stem cell niches in vivo, 1037-1051.e4, Copyright (2023) with permission from Elsevier. Full text @ Dev. Cell