
|
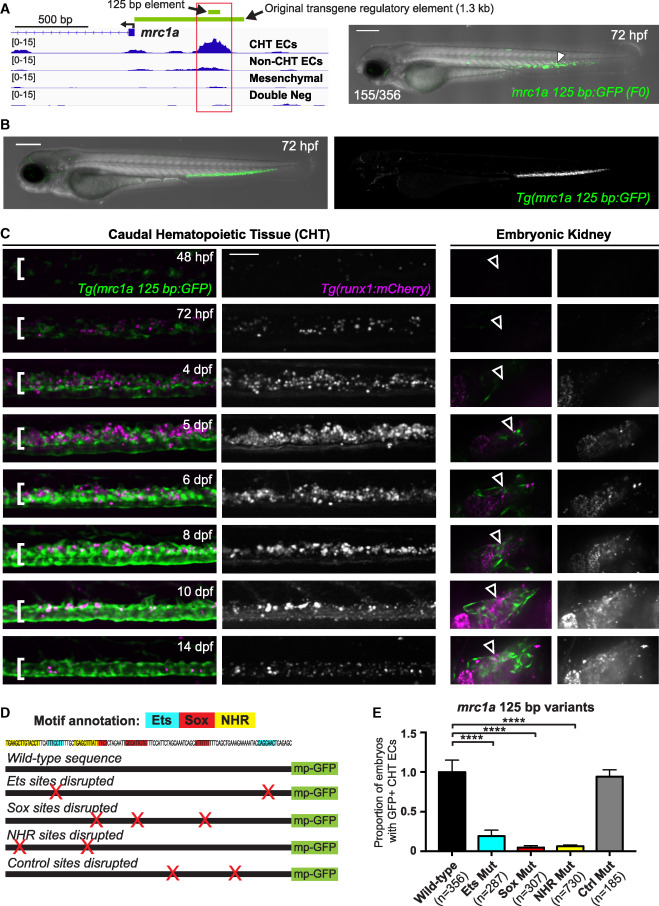
Fig. 4 CHT endothelial specific enhancer mutagenesis
(A) Gene tracks show a region of chromatin (red box) upstream of mrc1a that is uniquely open in the double-positive CHT EC fraction but not the other three cell populations. Green bars denote the position of the 125 bp enhancer sequence and the 1.3 kb sequence used to generate the reporter transgenes. Image on the right shows transient GFP expression in an F0 embryo injected with the 125 bp enhancer sequence coupled to a minimal promoter and GFP.
(B) Images show an embryo expressing the stably integrated mrc1a 125 bp:GFP transgene.
(C) Images show mrc1a 125bp:GFP (green) and runx1:mCherry (magenta) expression in the CHT (left) and kidney (right) at 8 different developmental time points. White brackets denote the location of the CHT and arrowheads point to the location of the developing kidney. Grayscale images of the runx1:mCherry signal are shown to the right of color overlays. Identical settings were used for image acquisition at each time point. The fluorescence intensity for the images in the figure was adjusted relative to the highest expression at 8 dpf. This results in the reduced fluorescence intensity in the image for the 48 hpf time point.
(D) Wild-type sequence of the 125 bp mrc1a enhancer is shown, annotated with colors highlighting the Ets, Sox, and NHR binding motifs. Schematic depicts enhancer-reporter constructs in which each class of motif or control regions was targeted by mutation. Red X’s denote the location of targeted sites. mp-GFP, mouse Beta-globin minimal promoter fused to GFP.
(E) Graphs report the frequency of embryos with GFP expression in CHT ECs after injection with wild-type sequences or mutated variants of the mrc1a 125 bp enhancer. Data is normalized to the wild-type control (44% [155/356]). Mean ± SEM, one-way ANOVA with Dunnett’s multiple comparisons test; ∗∗∗p < 0.001, ∗∗∗∗p < 0.0001. All experiments were performed at least three times, with independent clutches. Scale bar in (C) represents 100 μm.
Reprinted from Developmental Cell, 58(12), Hagedorn, E.J., Perlin, J.R., Freeman, R.J., Wattrus, S.J., Han, T., Mao, C., Kim, J.W., Fernández-Maestre, I., Daily, M.L., D'Amato, C., Fairchild, M.J., Riquelme, R., Li, B., Ragoonanan, D.A.V.E., Enkhbayar, K., Henault, E.L., Wang, H.G., Redfield, S.E., Collins, S.H., Lichtig, A., Yang, S., Zhou, Y., Kunar, B., Gomez-Salinero, J.M., Dinh, T.T., Pan, J., Holler, K., Feldman, H.A., Butcher, E.C., van Oudenaarden, A., Rafii, S., Junker, J.P., Zon, L.I., Transcription factor induction of vascular blood stem cell niches in vivo, 1037-1051.e4, Copyright (2023) with permission from Elsevier. Full text @ Dev. Cell