
- Title
-
Enhanced insulin activity achieved in VDRa/b ablation zebrafish
- Authors
- Liu, R., Lu, Y., Peng, X., Jia, J., Ruan, Y., Shi, S., Shu, T., Li, T., Jin, X., Zhai, G., He, J., Lou, Q., Yin, Z.
- Source
- Full text @ Front Endocrinol (Lausanne)
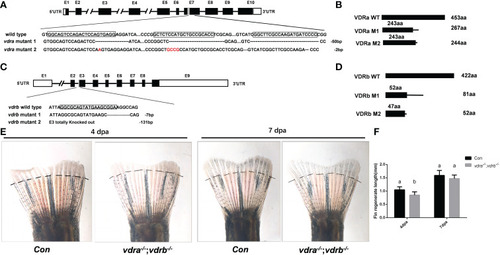
Generation of zebrafish vdra- and vdrb –deficient using CRISPR/Cas9 technique. (A) Targeted depletion of the vdra gene; The CRISPR/Cas9 target site was located in exon 7. Two genotypes, 50-bp deletion and 2-bp deletion, were used to establish the vdra knockout line (highlighted in red); (B) The diagram shows the predicted VDRa protein from wild-type, M1, and M2 zebrafish. M1 consisted of 243 amino acids identical to WT (green) and 24 miscoding amino acids (black); M2 consisted of 243 amino acids identical to WT and one miscoding amino acid (black); (C) Targeted depletion of the vdrb gene; The CRISPR/Cas9 target site was located in exon 3. Two genotypes, 7-bp deletion and 131-bp deletion, were used to establish the vdrb knockout line (highlighted in red); (D). The diagram shows the predicted VDRb protein from wild-type, M1, and M2 zebrafish. M1 consisted of 52 amino acids identical to WT (green) and 29 miscoding amino acids (black); M2 consisted of only 47 amino acids identical to WT and five miscoding amino acids (black). (E) Zebrafish(100dpf) caudal fin regeneration at 4 and 7days post amputation. Dashed lines indicated approximate amputation planes. (F). Statistical analysis of the regeneration length. Six fish were used in each group. The bars with different letters indicated significant difference(p<0.05). |
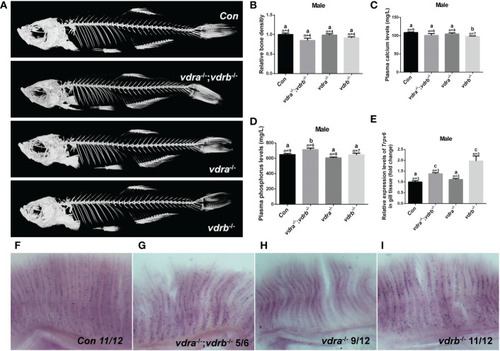
The activities of vdra and vdrb are dispensable for the calcium homeostasis and bone development. (A) Micro CT scanning images of mutants and control siblings at 100 dpf; (B) the relative bone density examined using CT scanning. (C) Calcium and (D) phosphorus levels in plasma were measured in mutants and control siblings at 100 dpf; (E) Quantitative real-time PCR assays show the trpv6 transcript levels in the gills of mutants and control siblings at 100 dpf. (F–I). The trpv6 expression patterns in the gill of the mutant and control. The representative images were selected and the blue-purple dot in the gills was the expression signals. The bars with different letters indicated significant difference (p<0.05). |

Retarded growth and accumulated adiposity observed in vdra-/- ;vdrb-/- zebrafish. (A) Comparison of the morphological features of mutants and control siblings at 100 dpf; (B–E) The body length and weight of the mutant lines and control siblings. (B, C) showed the zebrafish at 30dpf and (D, E) showed the zebrafish at 100dpf. (F) The total lipid levels of male mutants and controls at 100 dpf; controls, n = 15; vdra-/-;vdrb-/- , n = 12; vdra -/-;vdrb +/-, n = 12; vdra +/-;vdrb -/-, n = 16; (G) The levels of triglycerides in the liver of mutants and control siblings at 100 dpf; (H). Neutral lipids of juvenile mutants and size-matched controls (both with a standard length of 7.6 mm) were stained with Nile Red and viewed with stereoscope. The visceral adipose tissue was labeled by the surrounded dashed line. The bars with different letters indicated significant difference (p<0.05). |
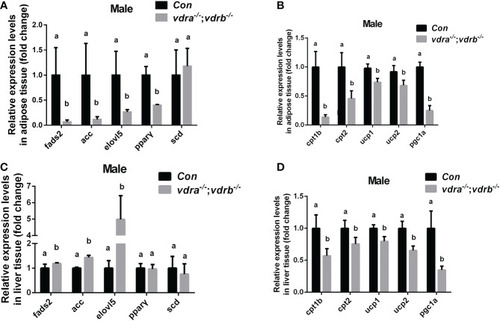
Transcriptional levels of maker genes involved in the lipogenesis and lipid oxidation. (A, C) Relative expression levels of marker genes involved in lipogenesis including fads2,acc,elovl5,pparγ and scd in adipose tissue (A) and liver tissue (C) of mutant line and control. Three biological repeats were carried out and statistical analysis was performed using a t test (n=3). (B, D) Relative expression levels of cpt1b, cpt2,ucp1, ucp2 and pgc1α in adipose tissue (A) and liver tissue (C) of mutant line and control. Three biological repeats were carried out and statistical analysis was performed using a t test (n=3). There was no difference between the two internal reference gene (β-actin and EF1α). The bars with different letters indicated significant difference (p<0.05). |
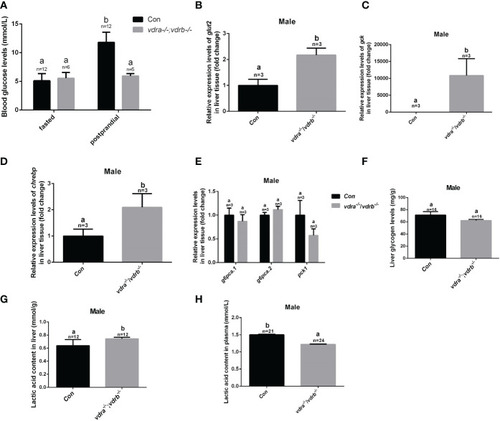
Glucose metabolic homeostasis was impaired in the liver of vdra-/- ;vdrb-/- zebrafish. (A) Blood glucose levels of vdra-/-;vdrb-/- fish and control siblings in the fasted state and postprandial state at 100 dpf. (B–D). Quantitative real-time PCR showed glut2, gck and chrebp transcriptional levels in the liver of mutants and control siblings at 100 dpf; (E) Quantitative real-time PCR showed gluconeogenesis marker gene g6pca.1, g6pca.2 and pck1 transcriptional levels in the liver of the vdra -/-;vdrb-/- fish and control siblings at 100dpf. (F) The liver glycogen levels in vdra -/-;vdrb -/- fish and control siblings at 100 dpf. (G, H). The liver lactic acid levels in vdra -/-;vdrb -/- fish and control siblings at 100 dpf. The bars with different letters indicated significant difference (p<0.05). |
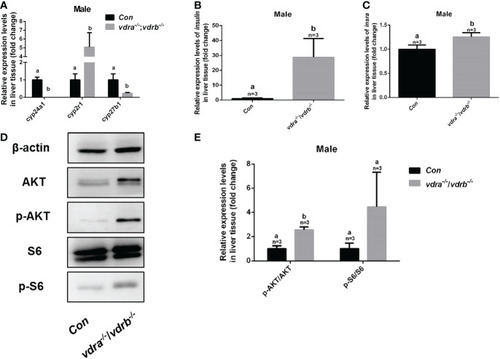
Enhanced insulin signaling observed in vdra-/- ;vdrb-/- zebrafish. (A) Quantitative real-time PCR showed the cyp24a1, cyp2r1 and cyp27b1 transcript levels in the liver of vdra-/;vdrb-/- fish and control siblings at 100 dpf; (B, C) Quantitative real-time PCR showed the insulin and insra, transcriptional levels in the liver of vdra-/;vdrb-/- fish and control siblings at 100 dpf; (D) AKT, p-AKT, S6, and p-S6 protein levels in liver samples of vdra-/-;vdrb-/- fish and control siblings at 100 dpf; (E) Quantification of relative p-AKT/AKT and p-S6/S6 protein levels from western blot analysis. |