
Figure 5
- ID
- ZDB-FIG-230305-16
- Publication
- Liu et al., 2023 - Enhanced insulin activity achieved in VDRa/b ablation zebrafish
- Other Figures
- All Figure Page
- Back to All Figure Page
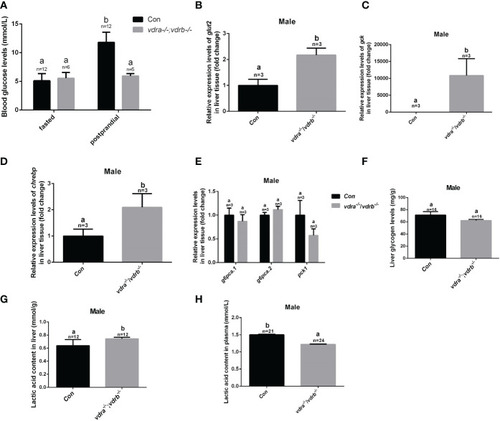
Glucose metabolic homeostasis was impaired in the liver of vdra-/- ;vdrb-/- zebrafish. (A) Blood glucose levels of vdra-/-;vdrb-/- fish and control siblings in the fasted state and postprandial state at 100 dpf. (B–D). Quantitative real-time PCR showed glut2, gck and chrebp transcriptional levels in the liver of mutants and control siblings at 100 dpf; (E) Quantitative real-time PCR showed gluconeogenesis marker gene g6pca.1, g6pca.2 and pck1 transcriptional levels in the liver of the vdra -/-;vdrb-/- fish and control siblings at 100dpf. (F) The liver glycogen levels in vdra -/-;vdrb -/- fish and control siblings at 100 dpf. (G, H). The liver lactic acid levels in vdra -/-;vdrb -/- fish and control siblings at 100 dpf. The bars with different letters indicated significant difference (p<0.05). |