
Figure 4
- ID
- ZDB-FIG-230305-15
- Publication
- Liu et al., 2023 - Enhanced insulin activity achieved in VDRa/b ablation zebrafish
- Other Figures
- All Figure Page
- Back to All Figure Page
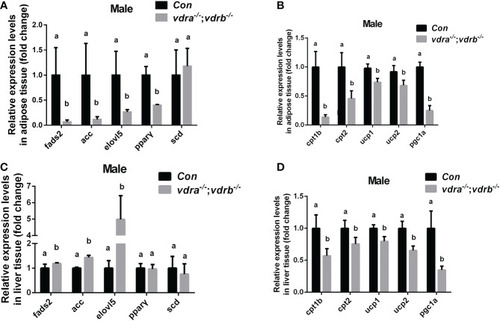
Transcriptional levels of maker genes involved in the lipogenesis and lipid oxidation. (A, C) Relative expression levels of marker genes involved in lipogenesis including fads2,acc,elovl5,pparγ and scd in adipose tissue (A) and liver tissue (C) of mutant line and control. Three biological repeats were carried out and statistical analysis was performed using a t test (n=3). (B, D) Relative expression levels of cpt1b, cpt2,ucp1, ucp2 and pgc1α in adipose tissue (A) and liver tissue (C) of mutant line and control. Three biological repeats were carried out and statistical analysis was performed using a t test (n=3). There was no difference between the two internal reference gene (β-actin and EF1α). The bars with different letters indicated significant difference (p<0.05). |