
- Title
-
Synthetic lethal targeting of TET2-mutant haematopoietic stem and progenitor cells by XPO1 inhibitors
- Authors
- Jing, C.B., Prutsch, N., He, S., Zimmerman, M.W., Landesman, Y., Look, A.T.
- Source
- Full text @ Br. J. Haematol.
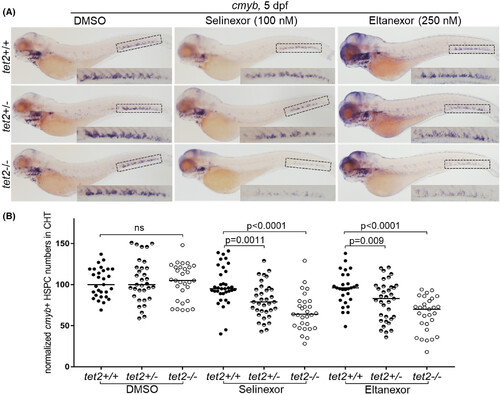
tet2-mutant haematopoietic stem and progenitor cells are hypersensitive to selinexor and eltanexor. (A) Embryos with the indicated genotypes were treated with either dimethylsulfoxide (DMSO), selinexor or eltanexor from 1–5 days post fertilisation (dpf). Whole-mount in situ hybridisation was performed using a riboprobe for c-myb at 5 dpf (overall magnification: 5×). Insets in each of the images show a magnified image of the caudal haematopoietic tissue (CHT) region (magnification in the inset: 11.25×). (B) Quantification of cells exhibiting c-myb expression in the CHT region shown in panel A.
|
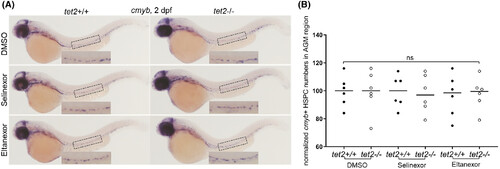
Selinexor and eltanexor treatment do not affect the birth of haematopoietic stem and progenitor cells (HSPCs) from the aorta-gonad-mesonephros (AGM) region. (A) Embryos with the indicated genotypes were treated with either dimethylsulfoxide (DMSO), selinexor (100 nM) or eltanexor (250 nM) dissolved in fish water from 1 to 2 days post fertilisation (dpf). Whole-mount in situ hybridisation was performed using a riboprobe for c-myb at 2 dpf and images were taken (overall magnification: 5×). Insets in each of the image magnify staining in the AGM region (magnification in the inset: 11.25×). (B) Quantification of cells with c-myb expression in the AGM region, as shown in panel A.
|
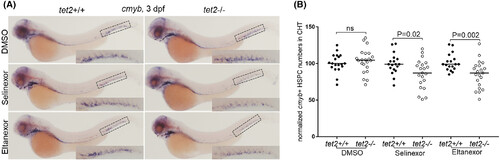
Exportin 1 (XPO1) inhibitors begin to induce decreased tet2-mutant haematopoietic stem and progenitor cells (HSPCs) in the caudal haematopoietic tissue (CHT) region at 3 days post fertilisation (dpf). (A) Embryos with the indicated genotypes were treated with either dimethylsulfoxide (DMSO), selinexor (100 nM) or eltanexor (250 nM) dissolved in fish water from 1–3 dpf. Whole-mount in situ hybridisation was performed using a riboprobe for c-myb at 3 dpf and images were taken. Boxes in each of the images magnify staining in the CHT region. (B) Quantification of c-myb expression in the CHT region as described in panel A.
|
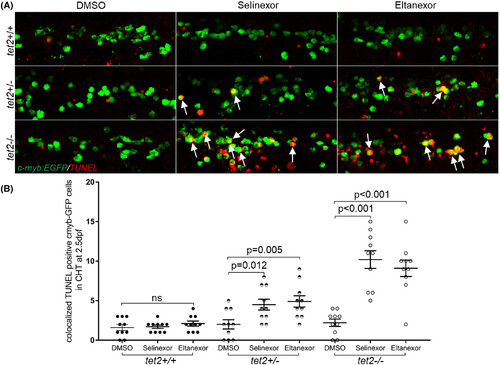
Exportin 1 (XPO1) inhibitors treatment induces apoptosis in tet2-mutant zebrafish HSPCs. (A) TUNEL and immunolabelling were performed on 2.5 days post fertilisation (dpf) embryos (treated with either dimethylsulfoxide [DMSO]; 100 nM selinexor, or 250 nM eltanexor) with the indicated genotypes in the Tg(c-myb:EGFP) background to identify haematopoietic stem and progenitor cells (HSPCs) anti- enhanced EGFP antibody, green) and apoptotic cells (TMR-red, red) in the caudal haematopoietic tissue (CHT) region. Fluorescence was visualized using confocal microscopy. White arrows indicate HSPCs undergoing apoptosis. (B) Quantification of EGFP+; TUNEL+ cells as described in panel A.
|
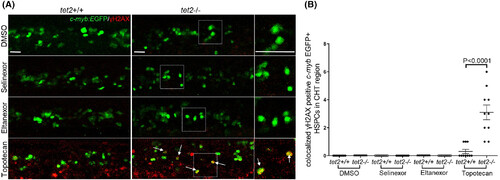
Exportin 1 (XPO1) inhibitors treatment does not induce DNA double-strand breaks in zebrafish haematopoietic stem and progenitor cells (HSPCs). (A) Immunolabelling was performed on 2.5 days post fertilisation embryos (treated with either dimethylsulfoxide (DMSO), 100 nM selinexor, 250 nM eltanexor or 200 nM topotecan) with the indicated genotypes in the Tg(c-myb:EGFP) background to identify HSPCs (anti-EGFP antibody; green) and DNA double-strand breaks (anti-γH2AX antibody; red) in the caudal haematopoietic tissue (CHT). White arrows indicate groups of HSPCs with DNA double-strand breaks. Magnified views of the regions in the dashed boxes are shown on the right. Scale bar: 25 μm. (B) Quantification of EGFP+; γH2AX+ cells as described in panel A.
|
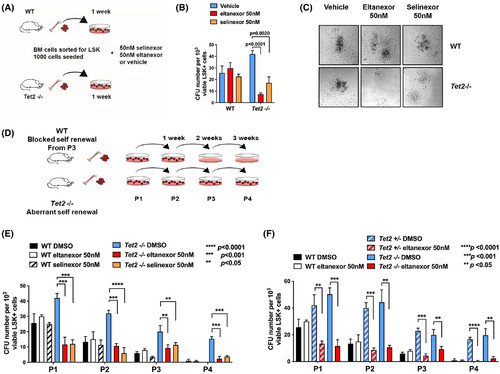
Exportin 1 (XPO1) inhibitor treatment selectively and dramatically decreases colony formation and the serial replating ability of Tet2-mutant murine haematopoietic stem and progenitor cells (HSPCs). Schematic representation of colony-forming unit assay. Bone marrow cells of wild-type (WT) or Tet2-mutant mice were sorted for Lin−Sca-1+c-Kit− (LSK) and 1000 LSK+ cells were plated on methylcellulose containing eltanexor, selinexor or vehicle. (B) Relative numbers of colonies of murine (WT) or Tet2-deficient HSPC cells surviving after treatment with selinexor or eltanexor. The number of colonies was determined after 7 days of culture in methylcellulose-containing drug or vehicle. Selinexor and eltanexor reduce Tet2-mutant colonies by ~50% or ~ 75% respectively but have little effect on normal HSPC plating efficiency. (C) Representative colony morphology with or without drug treatment. (D) Schematic of serial re-plating of murine WT or Tet2-deficient LSK+ HSPC cells in methylcellulose. Cells were treated with selinexor (50 nM) or eltanexor (50 nM) at each of the four passages (P1–P4). Total number of colony-forming units (CFU) was determined 7 d after each passage. (E, F) Relative number of colonies of murine WT or Tet2−/− € or Tet2+/− (f) HSPC cells surviving after treatment with selinexor (E) or eltanexor (E, F) at each of the four passages (P1–P4). Wild-type colonies do not re-plate beyond three passages (P3). Tet2-deficient HSPCs exhibit increased re-plating capacity, which is dramatically decreased by selinexor or eltanexor treatment.
|
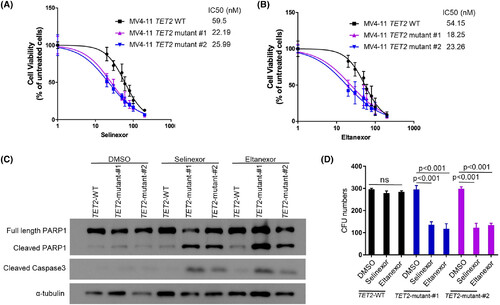
Exportin 1 (XPO1) inhibitors selectively kill TET2-mutant MV4-11 cells. (A, B) TET2 wild-type (WT) MV4-11 leukaemia cells and two clones created using different CRISPR guides of CRISPR-cas9-induced, TET2-inactivated MV4-11 cells were cultured with different concentrations of selinexor (A) or eltanexor (B) for 72 h. Cell viability was measured with the Cell-Titre Glo assay and the inhibitory concentration at 50% (IC50) is indicated for each group. Data represent the mean ± SD of three independent experiments. (C) TET2 WT and -mutant MV4-11 clones were treated with dimethylsulfoxide (DMSO), or 20 nM selinexor or 20 nM eltanexor for 16 h (for cleaved PARP and cleaved-Caspase3) and analysed by western blot. This experiment was performed three times with qualitatively similar results. (D) TET2 WT and two independent clones of CRISPR-cas9-induced, TET2-mutant MV4-11 cells were plated on methylcellulose containing (DMSO, selinexor (20 nM) or eltanexor (20 nM). The total number of colony-forming units (CFUs) was determined after 7 days.
|