
- Title
-
Top2a promotes the development of social behavior via PRC2 and H3K27me3
- Authors
- Geng, Y., Zhang, T., Alonzo, I.G., Godar, S.C., Yates, C., Pluimer, B.R., Harrison, D.L., Nath, A.K., Yeh, J.J., Drummond, I.A., Bortolato, M., Peterson, R.T.
- Source
- Full text @ Sci Adv
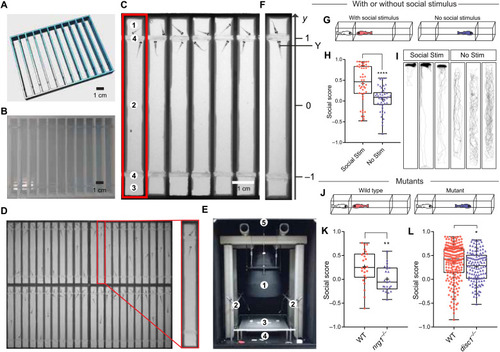
The Fishbook assay.
(A and B) The design and a 3D printed array of Fishbook arenas. (C) Screenshot of a Fishbook assay. Red rectangle: Fishbook arena; 1: social stimulus compartment; 2: social test compartment; 3: empty control compartment; 4: transparent windows. (D) An array of 44 arenas. (E) Fishbook imaging station. 1: telecentric lens; 2: white LED panels providing ambient light; 3: sample deck; 4: 850-nm infrared LED backlight panel; 5: charge-coupled device camera. (F) Social score is calculated as the average y-axis position for the duration of a test. (G to I) Fishbook with or without social stimulus fish (G), showing boxplots (H) and representative tracking plots (I) of WT fish tested with social stimulus (Social Stim; n = 44) or without social stimulus (No Stim; n = 44). In each boxplot, the box encloses data points from the 25th to 75th percentile, the horizontal line and cross mark the median and the mean, and the lines above and below the box reach data points with the maximum and minimum values. ****P < 0.0001. (J to L) Fishbook detects social deficits in mutants (J), comparing WT (n = 24) and homozygous nrg1-knockout (nrg1−/−; n = 23) fish, both from a heterozygous (nrg1+/−) incross and genotyped individually after Fishbook assay (K), and WT sibling (n = 209) and homozygous disc1-knockout (disc1−/−; n = 122) fish (L). *P < 0.05 and **P < 0.01. |
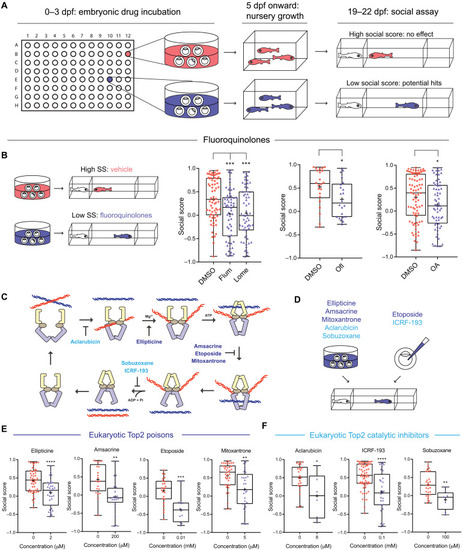
Screening for inhibitors of social development identifies fluoroquinolones and other Top2 inhibitors.
(A) Screening workflow. (B) Fluoroquinolones induce social deficits. Comparing DMSO (n = 68, 22, and 82, from left to right) with flumequine (Flum; 25 μM; n = 56), lomefloxacin (Lome; 100 μM; n = 60), ofloxacin (Ofl; 200 μM; n = 22), and oxolinic acid (OA; 200 μM; n = 62). SS, sodium salicylate. (C) The catalytic cycle of Top2 and inhibitors targeting different steps of the cycle. ATP, adenosine 5′-triphosphate; ADP, adenosine 5′-diphosphate. (D to F) Eukaryotic Top2 inhibitors induce social deficits (D). Comparing fish treated with vehicle control (0 μM in each panel); Top2 poisons ellipticine (0 μM: n = 48; 2 μM: n = 31), amsacrine (0 μM: n = 21; 200 μM: n = 20), etoposide (0 μM: n = 24; 10 μM: n = 11), and mitoxantrone (0 μM: n = 38; 5 μM: n = 29) (E); and Top2 catalytic inhibitors aclarubicin (0 μM: n = 22; 8 μM: n = 6), ICRF-193 (0 μM: n = 65; 100 μM: n = 29), and sobuzoxane (0 μM: n = 27; 100 μM: n = 8) (F). *P < 0.05, **P < 0.01, ***P < 0.001, and ****P < 0.0001. |
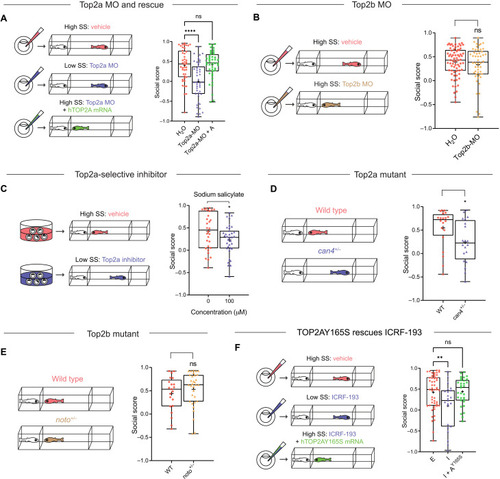
Top2a, rather than Top2b, is required for the development of social behavior.
(A) Top2a-MO (0.05 mM; n = 44) induces social deficits compared to vehicle (H2O, n = 44), which is rescued by hTOP2A mRNA (250 ng/μl; Top2a-MO + A, n = 44). (B) Top2b-MO (0.05 mM; n = 50) does not induce social deficits compared to vehicle (H2O, n = 71). (C) Top2a-selective inhibitor sodium salicylate (100 μM) induces social deficits. (D) Heterozygous can4 mutant (can4+/−, n = 20) exhibits social deficits compared to WT (n = 20). Both mutant and WT were acquired from a heterozygous (can4+/−) incross and genotyped individually after Fishbook assay. (E) Heterozygous noto mutant (noto+/−, n = 32) shows no social deficits compared to WT (n = 21). Both mutant and WT were acquired from a heterozygous (noto+/−) incross and genotyped individually after Fishbook assay. (F) ICRF-193 (I; 0.1 mM; n = 23) induced social deficits compared to the vehicle control ethanol (E; 1%; n = 50), which is rescued by hTOP2AY165S mRNA (250 ng/μl; I + AY165S, n = 31). ns, not significant; *P < 0.05, **P < 0.01, and ****P < 0.0001. |
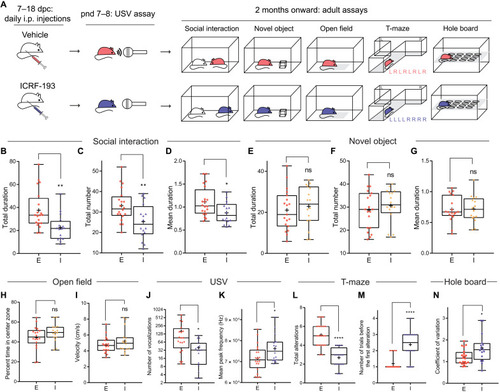
Prenatal inhibition of Top2 induces social communication impairments and increased perseveration in mouse.
(A) Experimental design for prenatal ICRF-193 injection and subsequent experiments for the offspring. L, left; R, right. (B to D) ICRF-193 (I, n = 16) reduces the total duration (B), total number (C), and mean duration (D) of social investigation compared to vehicle control ethanol (E, n = 20). (E to G) ICRF-193 (n = 16) does not reduce the total duration (E), total number (F), and mean duration (G) of novel object investigation compared to ethanol (n = 19). (H and I) ICRF-193 (n = 16) does not change the percentage of time spent in the center zone (H) and velocity (I) of mice in the open-field assay compared to ethanol (n = 18). (J and K) ICRF-193 (n = 16) reduces the total number (J) but increases the mean peak frequency (K) of USV compared to ethanol (n = 20). (L and M) ICRF-193 (n = 16) reduces the total number of alterations (the number of times a mouse enters an alternative arm compared to the previous trial) (L) while increasing the number of trials before the first alteration (M) compared to ethanol (n = 20) during a T-maze assay that consisted of eight trials. (N) ICRF-193 (n = 16) increases the coefficient of variation in the hole-board assay compared to ethanol (n = 20). *P < 0.05, **P < 0.01, and ****P < 0.0001. |
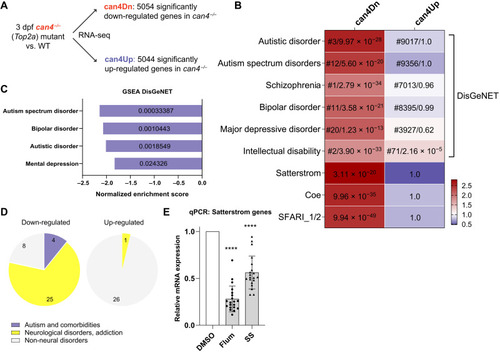
RNA-seq reveals down-regulation of autism risk genes caused by Top2a depletion.
(A) RNA-seq experimental design. (B) can4Dn, but not can4Up, is selectively enriched for autism and its comorbidities risk genes. For each cell, color represents odds ratio. Numbers in the top six rows represent ranking out of 24,166 diseases in the DisGeNET library (before slash) and adjusted P value (after slash). Numbers in the bottom three rows represent adjusted P value. SFARI_1/2, high-confidence SFARI genes with a gene score of 1 or 2. (C and D) GSEA analysis using the DisGeNET library shows enrichment for autism and its comorbidities risk genes (C) and neurological condition risk genes (D) in down-regulated. Value inside each bar represents false discovery rate (FDR) (C). Significance: FDR < 5%. (E) qPCR shows the down-regulation of Satterstrom genes in the brain of adult zebrafish that received embryonic treatment of 15 μM flumequine or 100 μM sodium salicylate compared to DMSO control. ****P < 0.0001. |
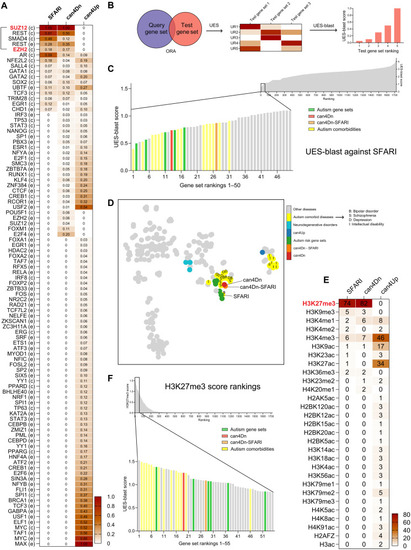
PRC2 and H3K27me3 are common upstream regulators of can4Dn and autism risk genes.
(A) SFARI genes and can4Dn, but not can4Up, share very similar enrichment profiles for upstream regulators. Value in each cell represents the significance score (Materials and Methods). In row labels, c indicates ChEA, and e indicates ENCODE, indicating the source of ChIP-seq data. (B) UES analysis and UES-blast workflow. ORA analysis finds significantly enriched upstream regulators for a test gene set using reference gene sets from the ChIP-X library. A significance score is calculated for each upstream regulator (Materials and Methods), creating a signature for each test gene set, which we named UES. A blast-style querying algorithm (UES-blast) then identifies test gene sets with the most similar UES compared to a query gene set, e.g., SFARI genes. UR, upstream regulator. (C) UES-blast (Materials and Methods) shows that can4Dn, can4Dn-SFARI, and several independently curated autism risk gene sets rank high among control gene sets against the query gene set of SFARI genes, indicating that they share a very similar UES with the SFARI genes. (D) tSNE clustering of can4Dn, can4Dn-SFARI, autism risk gene sets, and DisGeNET gene sets (only those containing >500 genes). Letters label autism comorbidities risk gene sets as follows: I, intellectual disability; D, depression; S, schizophrenia; B, bipolar disorder. (E) Genes in the SFARI and can4Dn gene sets, but not in can4Up, are specifically enriched for the H3K27me3 mark. (F) can4Dn, can4Dn-SFARI, and autism risk gene sets have the highest H3K27me3 scores when compared to the control gene sets. |
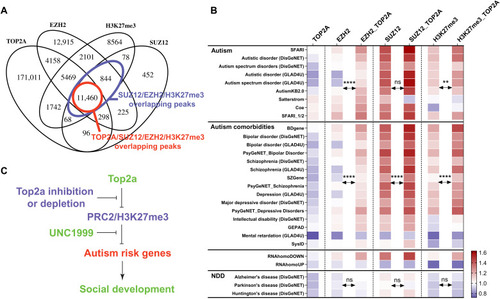
PRC2 and H3K27me3 mediate the Top2a-dependent gene regulation.
(A) TOP2A binding peaks substantially overlap with EZH2, SUZ12, and H3K27me3. (B) Among all EZH2, SUZ12, and H3K27me3 binding peaks, those that overlap with TOP2A are more enriched for autism and its comorbidities risk genes and can4Dn but not for can4Up and neurodegenerative disorder risk gene sets. Significance was calculated by paired t test. NDD, neurodegenerative disorders. SFARI_1/2, high-confidence SFARI genes with a gene score of 1 or 2. (C) Working model for how PRC2 and H3K27me3 mediate the Top2a-dependent gene regulation and social development. **P < 0.01 and ****P < 0.0001. |
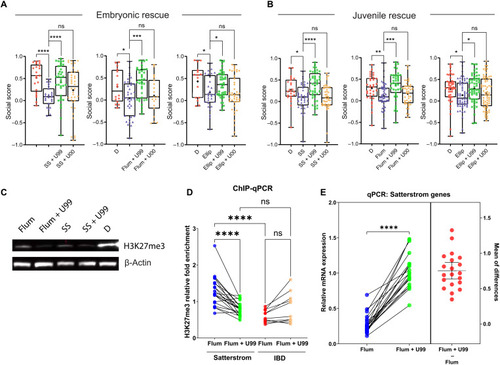
Social deficits induced by Top2a inhibition can be rescued by inhibiting PRC2.
(A) Embryonic (0 to 3 dpf) cotreatment of 10 μM UNC1999 (U99) with 100 μM sodium salicylate (n = 35), 15 μM flumequine (n = 37), and 0.5 μM ellipticine (Ellip; n = 44) rescues social deficits caused by sodium salicylate (n = 23), flumequine (n = 37), and ellipticine (n = 29) alone, respectively, compared to DMSO control (D; left to right: n = 21, 16, and 15). UNC1999’s inactive analog UNC2400 (U00) does not rescue social deficits (left to right: n = 38, 19, and 42). (B) Social deficits caused by embryonic treatment of sodium salicylate (n = 38), flumequine (n = 45), and ellipticine (n = 61) compared to DMSO (left to right: n = 23, 34, and 47) are rescued by overnight exposure to UNC1999 (left to right: n = 44, 39, and 56) but not UNC2400 (left to right: n = 42, 41, and 67) at the juvenile stage (20 to 21 dpf). (C) Western blot shows the global down-regulation of H3K27me3 in 3 dpf larvae by flumequine and sodium salicylate compared to DMSO control. Cotreatment of U99 further reduced H3K27me3, as expected. (D) ChIP-qPCR shows significant differences in the relative fold enrichment of H3K27me3 in Satterstrom versus IBD genes in 3 dpf larvae treated with flumequine. The relative H3K27me3 level is higher in Satterstrom (blue) than in IBD (red) genes. H3K27me3 was reduced in Satterstrom (green) and increased in IBD (brown) genes by U99. Each dot represents data for a single gene. (E) qPCR shows the down-regulation of Satterstrom genes in the brain of adult zebrafish that received embryonic treatment of flumequine (using the same data shown in Fig. 5E) compared to DMSO control. Embryonic cotreatment of U99 rescued gene expression. Differences in mRNA expression between these two samples (flumequine + U99 − flumequine) are shown as red dots; horizontal bars represent the mean and SD of the differences. Significance is calculated using paired t test. *P < 0.05, **P < 0.01, ***P < 0.001, and ****P < 0.0001. |