
|
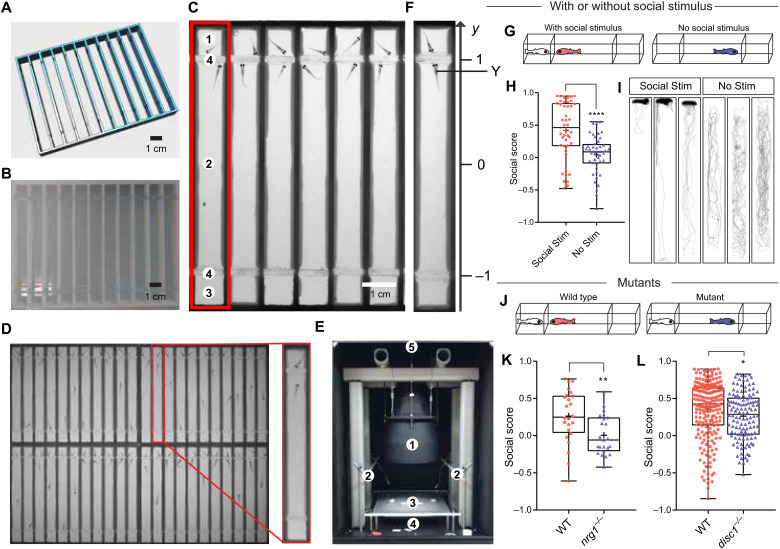
Fig. 1
(A and B) The design and a 3D printed array of Fishbook arenas. (C) Screenshot of a Fishbook assay. Red rectangle: Fishbook arena; 1: social stimulus compartment; 2: social test compartment; 3: empty control compartment; 4: transparent windows. (D) An array of 44 arenas. (E) Fishbook imaging station. 1: telecentric lens; 2: white LED panels providing ambient light; 3: sample deck; 4: 850-nm infrared LED backlight panel; 5: charge-coupled device camera. (F) Social score is calculated as the average y-axis position for the duration of a test. (G to I) Fishbook with or without social stimulus fish (G), showing boxplots (H) and representative tracking plots (I) of WT fish tested with social stimulus (Social Stim; n = 44) or without social stimulus (No Stim; n = 44). In each boxplot, the box encloses data points from the 25th to 75th percentile, the horizontal line and cross mark the median and the mean, and the lines above and below the box reach data points with the maximum and minimum values. ****P < 0.0001. (J to L) Fishbook detects social deficits in mutants (J), comparing WT (n = 24) and homozygous nrg1-knockout (nrg1−/−; n = 23) fish, both from a heterozygous (nrg1+/−) incross and genotyped individually after Fishbook assay (K), and WT sibling (n = 209) and homozygous disc1-knockout (disc1−/−; n = 122) fish (L). *P < 0.05 and **P < 0.01.