
Fig. 8.
- ID
- ZDB-FIG-221214-43
- Publication
- Geng et al., 2022 - Top2a promotes the development of social behavior via PRC2 and H3K27me3
- Other Figures
- All Figure Page
- Back to All Figure Page
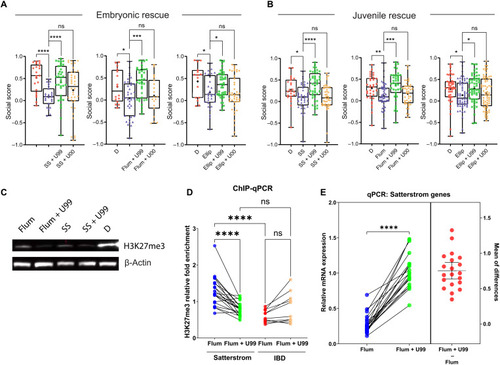
Social deficits induced by Top2a inhibition can be rescued by inhibiting PRC2.
(A) Embryonic (0 to 3 dpf) cotreatment of 10 μM UNC1999 (U99) with 100 μM sodium salicylate (n = 35), 15 μM flumequine (n = 37), and 0.5 μM ellipticine (Ellip; n = 44) rescues social deficits caused by sodium salicylate (n = 23), flumequine (n = 37), and ellipticine (n = 29) alone, respectively, compared to DMSO control (D; left to right: n = 21, 16, and 15). UNC1999’s inactive analog UNC2400 (U00) does not rescue social deficits (left to right: n = 38, 19, and 42). (B) Social deficits caused by embryonic treatment of sodium salicylate (n = 38), flumequine (n = 45), and ellipticine (n = 61) compared to DMSO (left to right: n = 23, 34, and 47) are rescued by overnight exposure to UNC1999 (left to right: n = 44, 39, and 56) but not UNC2400 (left to right: n = 42, 41, and 67) at the juvenile stage (20 to 21 dpf). (C) Western blot shows the global down-regulation of H3K27me3 in 3 dpf larvae by flumequine and sodium salicylate compared to DMSO control. Cotreatment of U99 further reduced H3K27me3, as expected. (D) ChIP-qPCR shows significant differences in the relative fold enrichment of H3K27me3 in Satterstrom versus IBD genes in 3 dpf larvae treated with flumequine. The relative H3K27me3 level is higher in Satterstrom (blue) than in IBD (red) genes. H3K27me3 was reduced in Satterstrom (green) and increased in IBD (brown) genes by U99. Each dot represents data for a single gene. (E) qPCR shows the down-regulation of Satterstrom genes in the brain of adult zebrafish that received embryonic treatment of flumequine (using the same data shown in Fig. 5E) compared to DMSO control. Embryonic cotreatment of U99 rescued gene expression. Differences in mRNA expression between these two samples (flumequine + U99 − flumequine) are shown as red dots; horizontal bars represent the mean and SD of the differences. Significance is calculated using paired t test. *P < 0.05, **P < 0.01, ***P < 0.001, and ****P < 0.0001. |