
|
Fig. 2
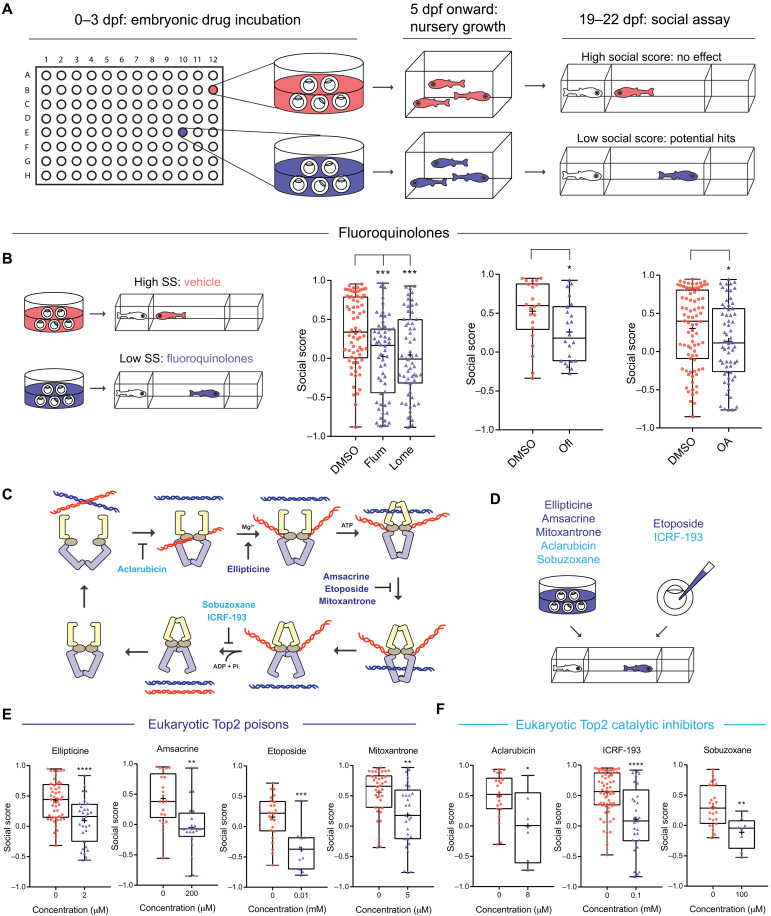
(A) Screening workflow. (B) Fluoroquinolones induce social deficits. Comparing DMSO (n = 68, 22, and 82, from left to right) with flumequine (Flum; 25 μM; n = 56), lomefloxacin (Lome; 100 μM; n = 60), ofloxacin (Ofl; 200 μM; n = 22), and oxolinic acid (OA; 200 μM; n = 62). SS, sodium salicylate. (C) The catalytic cycle of Top2 and inhibitors targeting different steps of the cycle. ATP, adenosine 5′-triphosphate; ADP, adenosine 5′-diphosphate. (D to F) Eukaryotic Top2 inhibitors induce social deficits (D). Comparing fish treated with vehicle control (0 μM in each panel); Top2 poisons ellipticine (0 μM: n = 48; 2 μM: n = 31), amsacrine (0 μM: n = 21; 200 μM: n = 20), etoposide (0 μM: n = 24; 10 μM: n = 11), and mitoxantrone (0 μM: n = 38; 5 μM: n = 29) (E); and Top2 catalytic inhibitors aclarubicin (0 μM: n = 22; 8 μM: n = 6), ICRF-193 (0 μM: n = 65; 100 μM: n = 29), and sobuzoxane (0 μM: n = 27; 100 μM: n = 8) (F). *P < 0.05, **P < 0.01, ***P < 0.001, and ****P < 0.0001.