
- Title
-
Elf3 deficiency during zebrafish development alters extracellular matrix organization and disrupts tissue morphogenesis
- Authors
- Sarmah, S., Hawkins, M.R., Manikandan, P., Farrell, M., Marrs, J.A.
- Source
- Full text @ PLoS One
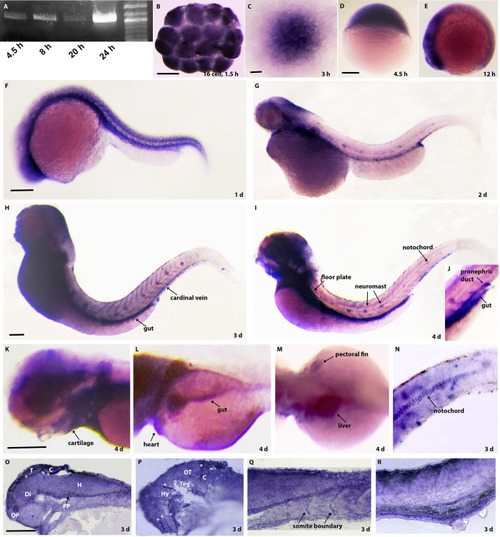
Expression of elf3 mRNA during zebrafish development.
(A) PCR detects elf3 mRNA during blastula (4.5 hpf), gastrula (8 hpf), and somitogenesis (20 and 24 hpf) stages. (B) In situ hybridization analysis shows elf3 mRNA expression in the 16 cell-stage embryos confirming maternal deposition. (C-D) During cleavage and blastula stages, elf3 mRNA is ubiquitously expressed. (E) During early somitogenesis period, elf3 mRNA is expressed more in the anterior region compared to the posterior region. (D-I) In situ hybridization detecting elf3 expression in 1 to 4 dpf larvae shows mRNA expression in distinct tissues. (J-N) High magnification images of 4 dpf stained larvae show elf3 mRNA expression in gut, pronephric duct (J), eye, cartilage (K), gut, heart (L), liver, pectoral fin (M), and in notochord (N). (O-R) 10 μM cryosections of the stained 3 dpf larvae show elf3 mRNA expression in different brain tissues and higher expressions in the boundaries of those tissues (O, P), in somite boundaries (Q) and in the gut and pronephric duct (R). T: telencephalon; C: cerebellum; OP: olfactory pit; Di: diencephalon; FP: floor plate; H: hindbrain; OT: optic tectum; Teg: tegmentum, Hy: hypothalamus; white asterisk: tissue boundary. Scale bar for B; C; D-E; F-G; H-I; K-M; and O-R = 200 μm. EXPRESSION / LABELING:
|

Knockdown of Elf3 severely affected zebrafish development.
(A-C) Live images of uninjected and elf3 morpholino injected embryos show development of the eye cup, telencephalon (t), forebrain ventricle, mesencephalon (m), midbrain-hindbrain boundary (mhb), and fourth ventricle in 1 dpf control (A) and moderately affected (B) and severely affected (C) embryos. Blue asterisk in C: dead cells. (D) First two bar graphs represent the body length percent of the control (black bar) and the morphant (grey bar) embryos (control embryo:100% ±4.5 (n = 39); elf3-UTR-MO injected embryo: 85.16% ±11.35 (n = 65; p<0.001). Other bar graphs represent the percent of the control and the morphant embryos with the labeled phenotype. (E-H) Live images of 2 dpf uninjected and elf3 morpholino injected embryos show normal morphology of the control embryo (E) and short body, bent tail, small eye, pericardial edema, twisted notochord, and aberrant fin-folds of the morphant embryos (F-H). (I-N) Live images show normal median and caudal fin-fold in control (I, L), and irregular or absence of fin-fold (black arrows) and lumps in the fin fold (blue arrows) in morphants at 2 and 5 dpf. (O, P) 3D reconstruction of the confocal images of the E-cadherin antibody stained larvae show regularly-shaped fin edge of the control larvae and jagged fin-edges of the morphants. Scale bar for A-C; E-H; and I-N = 200 μm. Scale bar for O, P = 100 μm. |

Elf3 knockdown affected craniofacial development.
(A-C) Live images of 5 dpf Elf3 morphants show protruded jaw (blue arrow) and smaller head (black arrow) and eye (B, C) compared to control (A). (D-L) Alcian blue stained head skeleton of control and morphant larvae. Ventral view shows normal cartilages in control (G) and near-normal Meckel’s (m) and ceratohyal cartilages (ch) and poorly developed branchial cartilages (cb 1–5) in morphants (H, I). Dorsal view shows normal neurocranium in control (J) and smaller ethmoid plate (purple arrow), lack of trabecula (tr and *), parachordal cartilage (pc and green arrow) and auditory cartilage (ac and yellow arrow) in morphants (K, L). (M-N”) Col2α1 and E-cadherin (Cdh1) antibody stained 3 dpf larvae marked developing Meckel’s, Ceratohyal, 1st and 2nd branchial arches, and ethmoid plate in control larvae (M-M”) and a pair of cartilage (presumably Ceratohyal) in the morphant larvae (N-N”). Scale bar for A-C; D-F; and G-L = 200 μm. Scale bar for M-N” = 100 μm. PHENOTYPE:
|
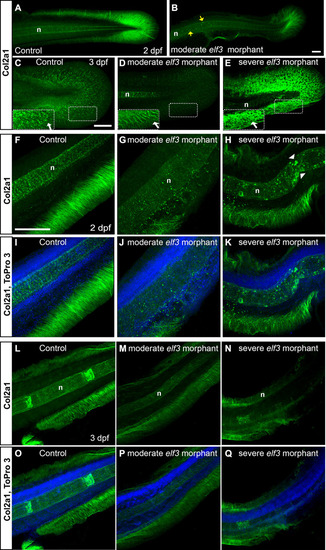
Elf3 deficiency led to disruption of Col2α1 expression in the fin and notochord.
(A-E) 3D reconstruction of the confocal images of the Col2α1 antibody stained embryos show dense Col2α1 fibrils radially distributed throughout the whole caudal fin in the control (A, C) and less dense, irregularly distributed fibrils in moderately affected morphants (B, D); severely affected morphant showed abnormal accumulation of Col2α1, but no fibrillary pattern (E). Insets show high magnification of the marked rectangle area. yellow arrow: abnormal Col2α1 accumulation within notochord; white arrow: Col2α1 fibrils. (F-Q) Optical section of the confocal images of the Col2α1 antibody stained embryos show severely disrupted and disorganization median fin fold collagen fibrils in the elf3 morphants at 2 dpf (G, H, J, K) and 3 dpf larva (M, N, P, Q) and nicely organized, thick fibrils in the control (F, I, L, O). Scale bar for A, B = 50 μm; for C-E = 100 μm; and for F-Q = 100 μm. PHENOTYPE:
|

Elf3 deficiency caused optic nerve fasciculation and arborization in the optic tectum defects and fragmentation of spinal motor neurons.
(A-C) Confocal imaging of acetylated tubulin stained embryos and 3D rendering shows tightly fasciculated optic nerves crossing at the optic chiasm in the control embryo (A) and a smaller de-fasciculated nerve in the morphants (B, C). (A’-C’) High magnification of the marked rectangle area in A-C. yellow asterisk show fibers de-fasciculated. (D-F) Confocal imaging of acetylated tubulin stained embryos and 3D rendering shows optic nerves arborized extensively within the tectal neuropil in the control embryo (D), and either fewer or no axon projections within that region in the Elf3 morphants (E, F). yellow perforated lines: presumptive tectal neuropil region; #: no axon projections. (G-I) 3D renderings of the confocal sections of acetylated tubulin stained 2 dpf control embryos showed thick bundles of caudal motor neurons arborized within muscle in control embryo (G, G’) and fragmented, abnormally branched and shorter axons in the morphants (H, H’, I, I’). (G’-I’) High magnification of the marked rectangle area in G-I. Arrow: short axon; #: fragmented axon. Scale bar for A-C, D-F and G-I = 100 μm. PHENOTYPE:
|
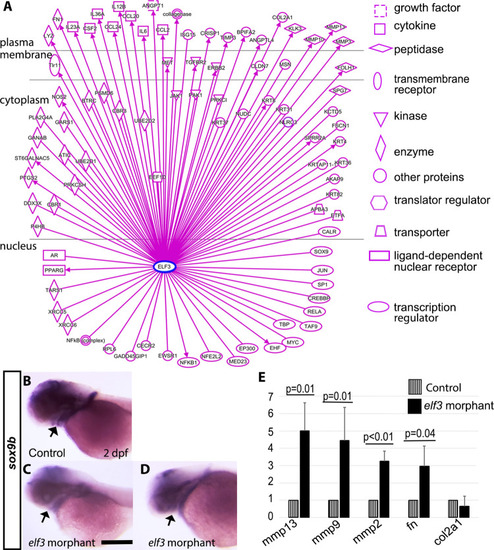
Dysregulation of extracellular matrix proteins in Elf3 morphants.
(A) IPA predicted direct relationships and downstream targets of Elf3. (B-D) In situ hybridization detecting sox9b expression at 2 dpf show strong expression in the retina, brain ventricular zone, craniofacial cartilages, and pectoral fin in the control embryos (B) and weaker expression in those areas in the morphants (C, D). arrow: developing craniofacial cartilages. (E) Quantitative RT-PCR assays comparing transcripts of mmp13, mmp9, mmp2, fn, and col2α1 (average fold change from at least 3 independent experiments) show altered levels of expression of those genes in morphants compared to control, Student’s t-test: P<0.05. Scale bar for B-D = 200 μm. |