
- Title
-
Zebrafish parental progeny investment in response to cycling thermal stress and hypoxia: deposition of heat shock proteins but not cortisol
- Authors
- Lim, M.Y., Bernier, N.J.
- Source
- Full text @ J. Exp. Biol.
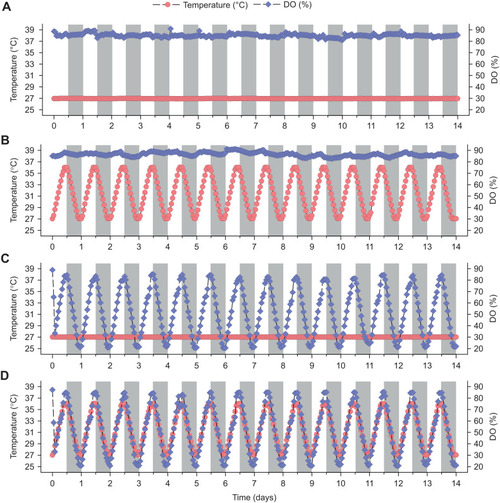
Experimental treatments. Temperature and percentage dissolved oxygen (DO) profiles of the (A) control, (B) cycling temperature, (C) cycling hypoxia and (D) combined exposure treatments. In B–D, temperature and/or DO was increased during the light phase (white background) and decreased during the dark phase (grey background). Note that maximum temperature and minimum % DO levels are offset from each other by 12 h. Although temperature and DO measurements were taken every second, only the 60 min running means are shown over the course of 14 days for presentation clarity. |
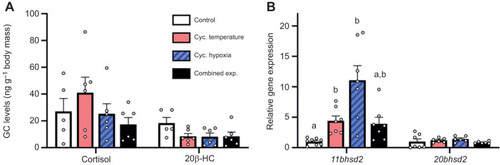
Effects of experimental treatments on whole-body glucocorticoid (GC) levels and gill gene expression in adult female zebrafish. (A) Whole-body cortisol and 20β-hydroxycortisone (20β-HC) levels. (B) Gill 11bhsd2 and 20bhsd2 relative gene expression. Gene expression values were normalized to the geometric mean of ef1α and rpl13a expression, and the expression ratio for each gene is presented relative to the control treatment. Values are means+s.e.m. (cortisol and 20β-HC, n=5–6; 11bhsd2, n=7–8; 20bhsd2, n=6–7). Cortisol and 20β-HC levels were compared with one-way ANOVA (P=0.298 and P=0.091, respectively). Statistical differences between gene expression values were determined by Kruskal–Wallis one-way ANOVA followed by post hoc Dunn's test (11bhsd2, P<0.001; 20bhsd2, P=0.267). Values for a given parameter that do not share a common letter are significantly different from one another. |
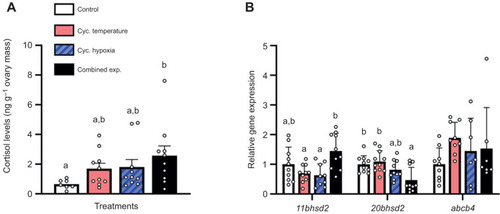
Effects of experimental treatments on ovary cortisol levels and gene expression in adult female zebrafish. (A) Ovary cortisol levels. (B) Ovary 11bhsd2, 20bhsd2 and abcb4 relative gene expression. Gene expression data were normalized and expressed as stated in Fig. 2. Values are means+s.e.m. (cortisol, n=10 except for control where n=7; 11bhsd2, n=9–10; 20bhsd2, n=10–11; abcb4, n=7–9). Cortisol levels were square-root transformed prior to being compared with a one-way ANOVA with a post hoc Holm–Šidák test (F=2.906, d.f.=3, P=0.049). Statistical differences between gene expression values were determined by a one-way ANOVA with a post hoc Holm–Šidák test (11bhsd2, P=0.003) or a Kruskal–Wallis one-way ANOVA on ranks with post hoc Dunn's test (20bhsd2, P=0.010; abcb4, P=0.091). Values for a given parameter that do not share a common letter are significantly different from one another. |
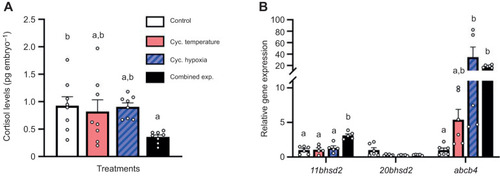
Effects of parental treatment on zebrafish embryo cortisol levels and gene expression. (A) Cortisol levels and (B) 11bhsd2, 20bhsd2 and abcb4 relative gene expression of ∼1 h post-fertilization (hpf) embryos derived from adult zebrafish exposed to the experimental treatments. Gene expression data were normalized and expressed as stated in Fig. 2. Values are means+s.e.m. (cortisol, n=8; 11bhsd2, 20bhsd2 and abcb4, n=5–6). Cortisol levels were compared with a one-way ANOVA with a post hoc Holm–Šidák test (F=3.631, d.f.=3, P=0.025). Statistical differences between gene expression values were determined by a one-way ANOVA with a post hoc Holm–Šidák test (11bhsd2, P<0.001) or a Kruskal–Wallis one-way ANOVA on ranks with a post hoc Dunn's test (20bhsd2, P=0.114; abcb4, P=0.001). Values for a given parameter that do not share a common letter are significantly different from one another. |
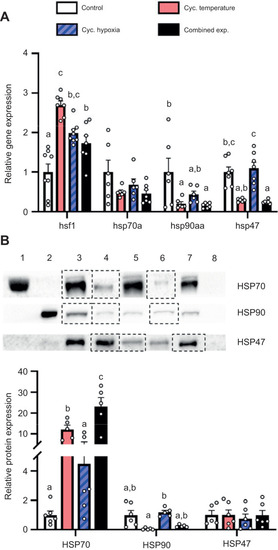
Effects of experimental treatments on the gill cellular stress response in adult female zebrafish. (A) Gill hsf1, hsp70a, hsp90aa and hsp47 relative gene expression. (B) Representative western blot and HSP70, HSP90 and HSP47 relative protein expression. Gene expression data were normalized and expressed as stated in Fig. 2. Western blot shows HSP70 standard (lane 1), HSP90 standard (lane 2), pool of heat-stressed gills (positive control; lane 3), control treatment (lane 4), cycling temperature treatment (lane 5), cycling hypoxia treatment (lane 6), combined exposure treatment (lane 7) and blank (lane 8). Dashed lines around a lane represent the splicing of separate gel images. Protein expression was normalized to Coomassie stain band intensity and expressed relative to the control treatment for each protein. Values are means+s.e.m. (hsf1, n=7–8; hsp70a, hsp90aa and hsp47, n=6–7; HSP70, HSP90 and HSP47, n=5–6). Statistical differences between gene expression values were determined by Kruskal–Wallis one-way ANOVA followed by post hoc Dunn's test (hsf1, P<0.001; hsp70a, P=0.363; hsp90aa, P<0.001; hsp47, P<0.001). HSP70 protein expression was square-root transformed prior to analysis; statistical differences between protein expression values were determined by one-way ANOVA followed by post hoc Holm–Šidák tests (HSP70, P<0.001; HSP90, P=0.027) or a Kruskal–Wallis one-way ANOVA (HSP47, P=0.868). Values for a given parameter that do not share a common letter are significantly different from one another. |
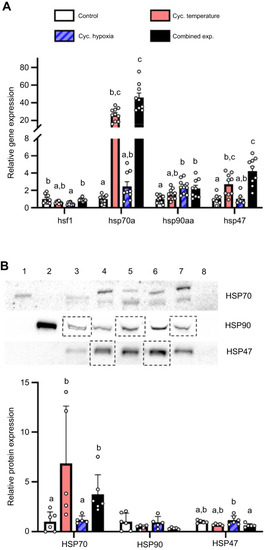
Effects of experimental treatments on the ovary cellular stress response in adult female zebrafish. (A) Ovary hsf1, hsp70a, hsp90aa and hsp47 relative gene expression. (B) Representative western blot and HSP70, HSP90 and HSP47 relative protein expression. Gene expression data were normalized and expressed as stated in Fig. 2. Western blot bands and normalization of protein expression are as stated in Fig. 5. Values are means+s.e.m. (hsf1, n=9–10; hsp70a and hsp90aa, n=9–11; hsp47, n=7–9; HSP70, HSP90 and HSP47, n=5–6). Statistical differences between gene expression values were determined by Kruskal–Wallis one-way ANOVA followed by post hoc Dunn's test (hsf1, hsp70a, hsp90aa and hsp47, P<0.001). HSP90 protein expression was square-root transformed prior to analysis; statistical differences between protein expression values were determined by one-way ANOVA followed by post hoc Holm–Šidák tests (HSP90, P=0.288; HSP47, P=0.019) or a Kruskal–Wallis one-way ANOVA followed by post hoc Dunn's test (HSP70, P=0.002). Values for a given parameter that do not share a common letter are significantly different from one another. |
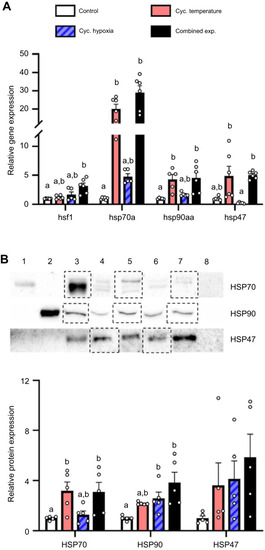
Effects of parental treatment on zebrafish embryo cellular stress response. (A) hsf1, hsp70a, hsp90aa and hsp47 relative gene expression, and (B) representative western blot and HSP70, HSP90 and HSP47 relative protein expression in ∼1 hpf embryos derived from adult zebrafish exposed to the experimental treatments. Gene expression data were normalized and expressed as stated in Fig. 2. Western blot bands and normalization of protein expression are as stated in Fig. 5. Values are means±s.e.m. (hsf1, hsp70a, hsp90aa and hsp47, n=5–6; HSP70, HSP90 and HSP47, n=5). Statistical differences between gene expression values were determined by Kruskal–Wallis one-way ANOVA followed by post hoc Dunn's test (hsf1, P=0.014; hsp70a, P<0.001; hsp90aa, P=0.002; hsp47, P<0.001). HSP70 protein expression was log-transformed prior to analysis; statistical differences between protein expression values were determined by one-way ANOVA followed by post hoc Holm–Šidák tests (HSP70, P=0.010; HSP47, P=0.175) or a Kruskal–Wallis one-way ANOVA followed by post hoc Dunn's test (HSP90, P=0.004). Values for a given parameter that do not share a common letter are different from one another. |