
|
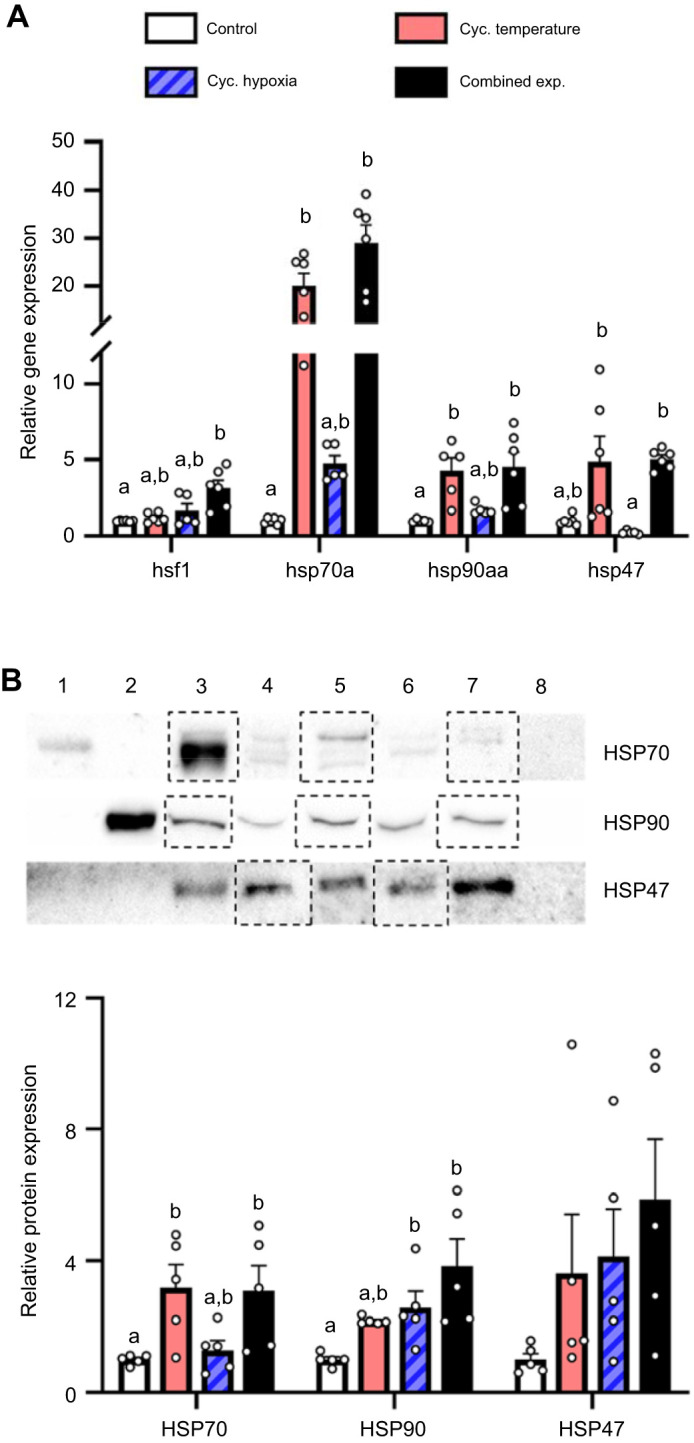
Fig. 7.
Effects of parental treatment on zebrafish embryo cellular stress response. (A) hsf1, hsp70a, hsp90aa and hsp47 relative gene expression, and (B) representative western blot and HSP70, HSP90 and HSP47 relative protein expression in ∼1 hpf embryos derived from adult zebrafish exposed to the experimental treatments. Gene expression data were normalized and expressed as stated in Fig. 2. Western blot bands and normalization of protein expression are as stated in Fig. 5. Values are means±s.e.m. (hsf1, hsp70a, hsp90aa and hsp47, n=5–6; HSP70, HSP90 and HSP47, n=5). Statistical differences between gene expression values were determined by Kruskal–Wallis one-way ANOVA followed by post hoc Dunn's test (hsf1, P=0.014; hsp70a, P<0.001; hsp90aa, P=0.002; hsp47, P<0.001). HSP70 protein expression was log-transformed prior to analysis; statistical differences between protein expression values were determined by one-way ANOVA followed by post hoc Holm–Šidák tests (HSP70, P=0.010; HSP47, P=0.175) or a Kruskal–Wallis one-way ANOVA followed by post hoc Dunn's test (HSP90, P=0.004). Values for a given parameter that do not share a common letter are different from one another.