
|
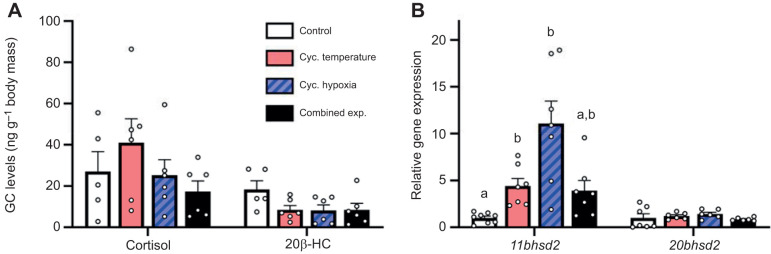
Fig. 2.
Effects of experimental treatments on whole-body glucocorticoid (GC) levels and gill gene expression in adult female zebrafish. (A) Whole-body cortisol and 20β-hydroxycortisone (20β-HC) levels. (B) Gill 11bhsd2 and 20bhsd2 relative gene expression. Gene expression values were normalized to the geometric mean of ef1α and rpl13a expression, and the expression ratio for each gene is presented relative to the control treatment. Values are means+s.e.m. (cortisol and 20β-HC, n=5–6; 11bhsd2, n=7–8; 20bhsd2, n=6–7). Cortisol and 20β-HC levels were compared with one-way ANOVA (P=0.298 and P=0.091, respectively). Statistical differences between gene expression values were determined by Kruskal–Wallis one-way ANOVA followed by post hoc Dunn's test (11bhsd2, P<0.001; 20bhsd2, P=0.267). Values for a given parameter that do not share a common letter are significantly different from one another.