
Fig. 6.
- ID
- ZDB-FIG-221219-18
- Publication
- Lim et al., 2022 - Zebrafish parental progeny investment in response to cycling thermal stress and hypoxia: deposition of heat shock proteins but not cortisol
- Other Figures
- All Figure Page
- Back to All Figure Page
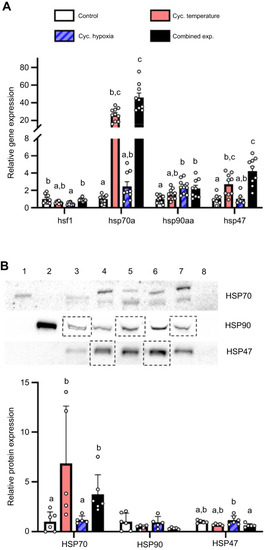
Effects of experimental treatments on the ovary cellular stress response in adult female zebrafish. (A) Ovary hsf1, hsp70a, hsp90aa and hsp47 relative gene expression. (B) Representative western blot and HSP70, HSP90 and HSP47 relative protein expression. Gene expression data were normalized and expressed as stated in Fig. 2. Western blot bands and normalization of protein expression are as stated in Fig. 5. Values are means+s.e.m. (hsf1, n=9–10; hsp70a and hsp90aa, n=9–11; hsp47, n=7–9; HSP70, HSP90 and HSP47, n=5–6). Statistical differences between gene expression values were determined by Kruskal–Wallis one-way ANOVA followed by post hoc Dunn's test (hsf1, hsp70a, hsp90aa and hsp47, P<0.001). HSP90 protein expression was square-root transformed prior to analysis; statistical differences between protein expression values were determined by one-way ANOVA followed by post hoc Holm–Šidák tests (HSP90, P=0.288; HSP47, P=0.019) or a Kruskal–Wallis one-way ANOVA followed by post hoc Dunn's test (HSP70, P=0.002). Values for a given parameter that do not share a common letter are significantly different from one another. |