
Image
|
Figure Caption
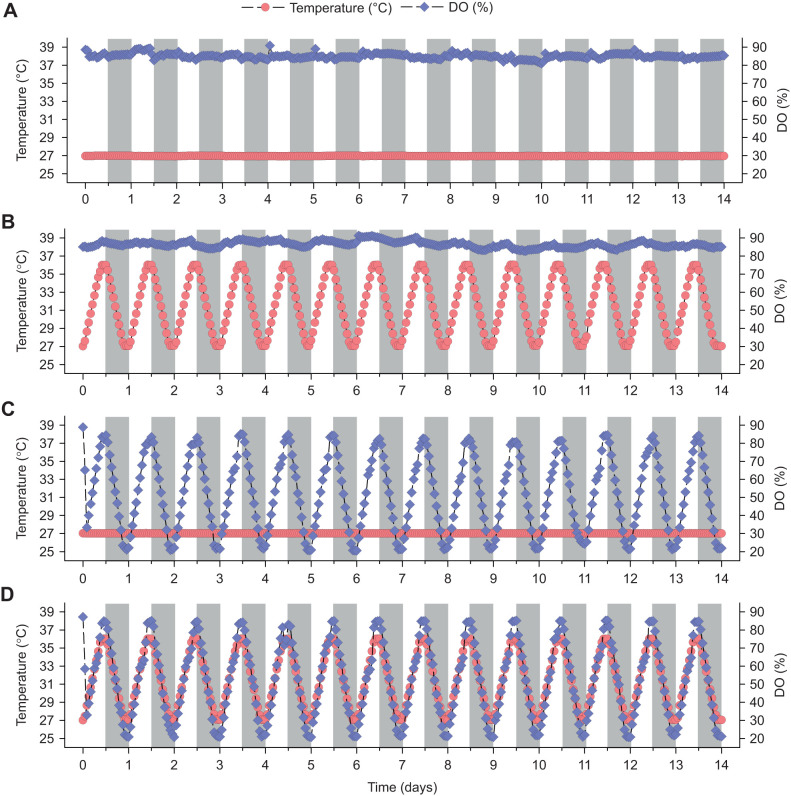
Fig. 1.
Experimental treatments. Temperature and percentage dissolved oxygen (DO) profiles of the (A) control, (B) cycling temperature, (C) cycling hypoxia and (D) combined exposure treatments. In B–D, temperature and/or DO was increased during the light phase (white background) and decreased during the dark phase (grey background). Note that maximum temperature and minimum % DO levels are offset from each other by 12 h. Although temperature and DO measurements were taken every second, only the 60 min running means are shown over the course of 14 days for presentation clarity.
Acknowledgments
This image is the copyrighted work of the attributed author or publisher, and
ZFIN has permission only to display this image to its users.
Additional permissions should be obtained from the applicable author or publisher of the image.
Full text @ J. Exp. Biol.