
|
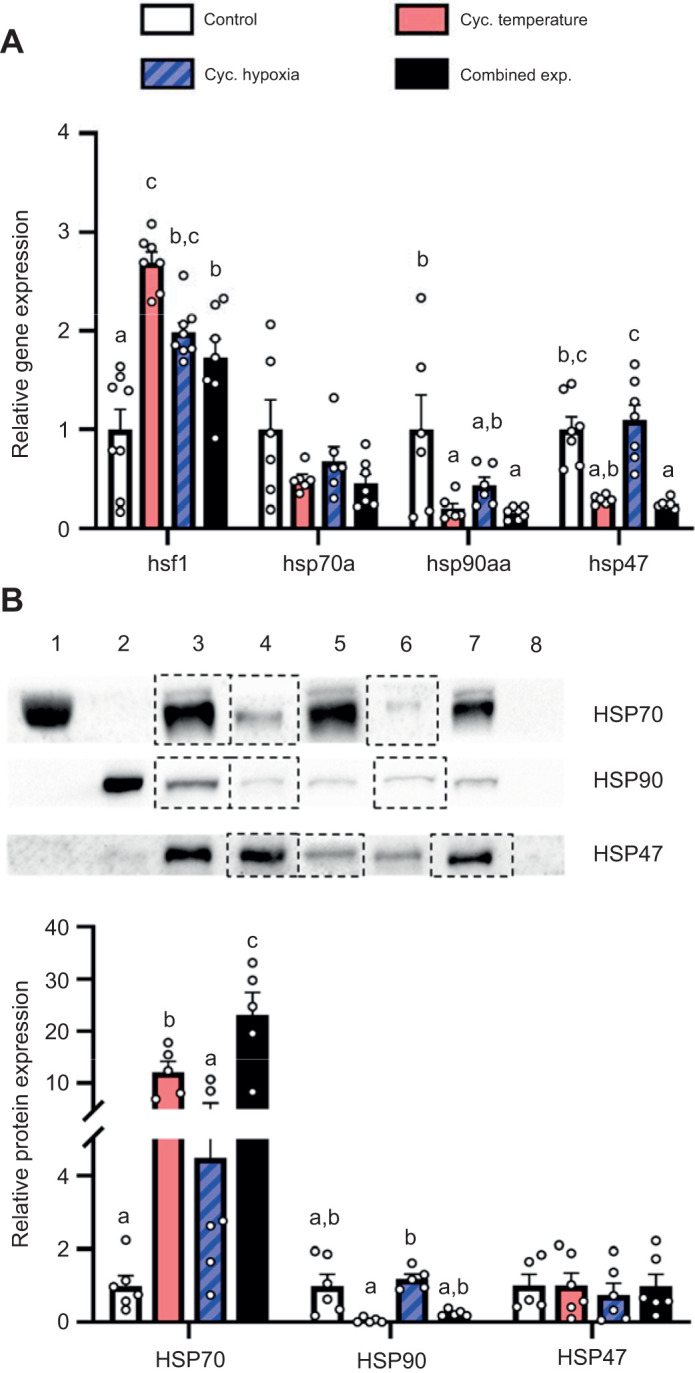
Fig. 5.
Effects of experimental treatments on the gill cellular stress response in adult female zebrafish. (A) Gill hsf1, hsp70a, hsp90aa and hsp47 relative gene expression. (B) Representative western blot and HSP70, HSP90 and HSP47 relative protein expression. Gene expression data were normalized and expressed as stated in Fig. 2. Western blot shows HSP70 standard (lane 1), HSP90 standard (lane 2), pool of heat-stressed gills (positive control; lane 3), control treatment (lane 4), cycling temperature treatment (lane 5), cycling hypoxia treatment (lane 6), combined exposure treatment (lane 7) and blank (lane 8). Dashed lines around a lane represent the splicing of separate gel images. Protein expression was normalized to Coomassie stain band intensity and expressed relative to the control treatment for each protein. Values are means+s.e.m. (hsf1, n=7–8; hsp70a, hsp90aa and hsp47, n=6–7; HSP70, HSP90 and HSP47, n=5–6). Statistical differences between gene expression values were determined by Kruskal–Wallis one-way ANOVA followed by post hoc Dunn's test (hsf1, P<0.001; hsp70a, P=0.363; hsp90aa, P<0.001; hsp47, P<0.001). HSP70 protein expression was square-root transformed prior to analysis; statistical differences between protein expression values were determined by one-way ANOVA followed by post hoc Holm–Šidák tests (HSP70, P<0.001; HSP90, P=0.027) or a Kruskal–Wallis one-way ANOVA (HSP47, P=0.868). Values for a given parameter that do not share a common letter are significantly different from one another.