
- Title
-
Isoquinoline Alkaloids from Coptis chinensis Franch: Focus on Coptisine as a Potential Therapeutic Candidate against Gastric Cancer Cells
- Authors
- Nakonieczna, S., Grabarska, A., Gawel, K., Wróblewska-Łuczka, P., Czerwonka, A., Stepulak, A., Kukula-Koch, W.
- Source
- Full text @ Int. J. Mol. Sci.
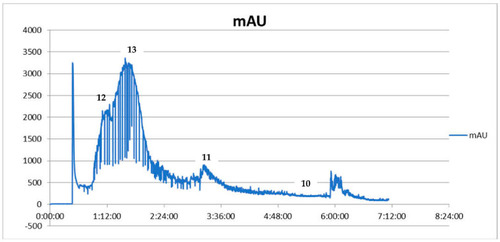
CPC chromatogram showing the fractionation of Coptis chinensis methanolic extract from the roots expressed as intensity units (mAU) to time (UV detection at 290 nm) (12—palmatine, 13—berberine, 11—coptisine, 10—jatrorrhizine). |
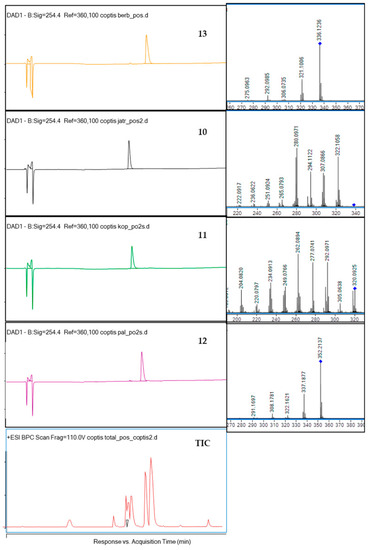
The HPLC-DAD chromatograms of the isolated compounds 13, 10, 11, 12 and of the total ion chromatogram (TIC) at 254 nm together with their fragmentation spectra (on the right side) and the crude extract chromatogram. |
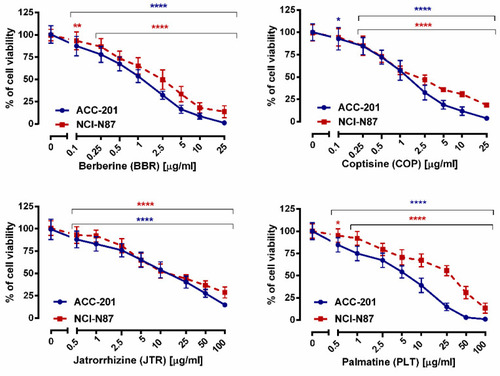
The effect of isoquinoline alkaloids isolated from Coptis chinensis on the viability of human GC cell lines was measured by MTT assay after 72 h. Results are presented as mean ± SD at each concentration. (* p < 0.05; ** p < 0.01; **** p < 0.0001 vs. control group; Tukey’s post-hoc test), n = 24 per concentration from three independent experiments. |
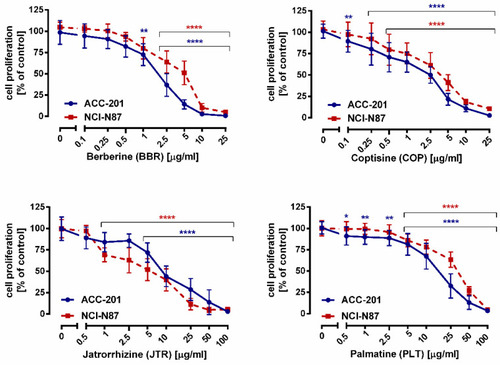
The effect of isoquinoline alkaloids isolated from Coptis chinensis on the proliferation of human gastric cancer cell lines was measured by BrdU assay after 72 h. Results are presented as mean ± SD at each concentration. (* p < 0.05; ** p < 0.01; **** p < 0.0001 vs. control group; Tukey’s post-hoc test), n = 24 per concentration from three independent experiments. |
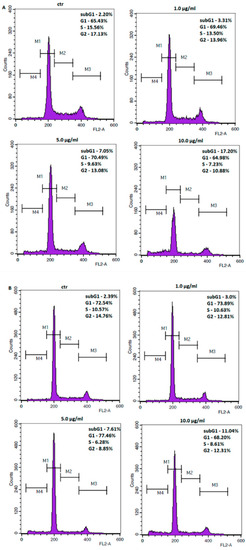
Representative flow cytometry histogram peaks of the ACC-201 (A) and NCI-N87 (B) gastric cancer cell lines after the treatment with a medium (ctr) and coptisine (11). Region M1, M2, M3 and M4 included G1, S, G2 and subG1 phase, respectively. |
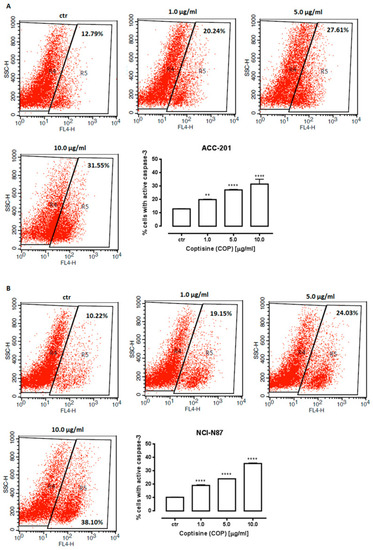
Representative flow cytometry dot plot graphs of ACC-201 (A) and NCI-N87 (B) gastric cell lines after the treatment with a medium (ctr) and coptisine (11). Region R5 included apoptotic cells with active caspase-3. Results are presented as mean ± SD at each concentration (** p < 0.01; **** p < 0.0001 vs. control group; Tukey’s post-hoc test), n = 5 per concentration from three independent experiments. |
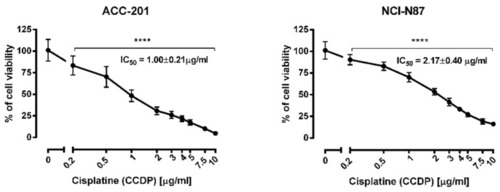
The effect of cisplatin (CDDP) on the viability of human gastric cancer cell lines was measured by MTT assay after 72 h. Results are presented as mean ± SD at each concentration. (**** p < 0.0001 vs. control group; Tukey’s post-hoc test), n = 24 per concentration from three independent experiments. |
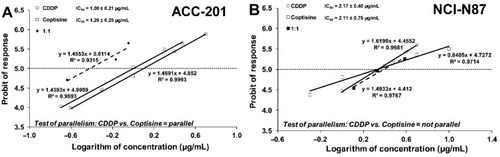
Log-probit dose–response relationship curves (DRRCs) for cisplatin (CDDP) and coptisine (11) administered alone, and in combinations at the fixed ratio of 1:1 (dotted line), illustrating the anti-proliferative effects of the drugs in the human gastric cancer cell lines ACC-201 (A) and NCI-N87 (B) measured in vitro by the MTT assay. |
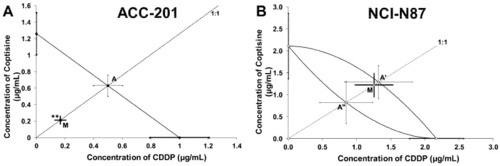
Type I isobolographic analysis for parallel (A) and non-parallel (B) dose–response relationship curves (DRRCs) between cisplatin (CDDP) and coptisine (11) at the fixed-ratio of 1:1 in gastric cancer cell lines measured in vitro by the MTT assay. ** p < 0.01 vs. IC50add. |
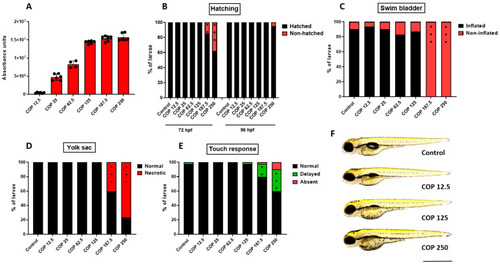
(A) The absorbance of different doses of coptisine (11) (12.5, 25, 62.5, 125, 187.5 or 250 µg/mL) (39.02, 78.04, 195.12, 390.24, 585.37 or 780.49 µM) by larval zebrafish after 95 h of incubation, n = 4–6 samples/group, n = 100 larvae per sample. Dose-dependent effect of coptisine (11) on (B) hatching rate (%) of 72 and 96 hpf-old larvae, n = 20–24/group; (C) swim bladder inflation at 96 hpf, n = 30–34/group; (D) yolk sac necrosis at 96 hpf, n = 30–34/group; (E) touch-evoked response at 96 hpf, n = 30–34/group; (F) representative images of larvae exposed to coptisine (11) (12.5, 125 or 250 µg/mL) (39.02, 390.24 or 780.49 µM). All experiments were done in triplicates and data were pooled together (** p < 0.01; *** p < 0.001 vs. control group, Fisher’s exact test). COP-coptisine (11), hpf—hours post-fertilization. Scale bar 1 mm. |