
Image
|
Figure Caption
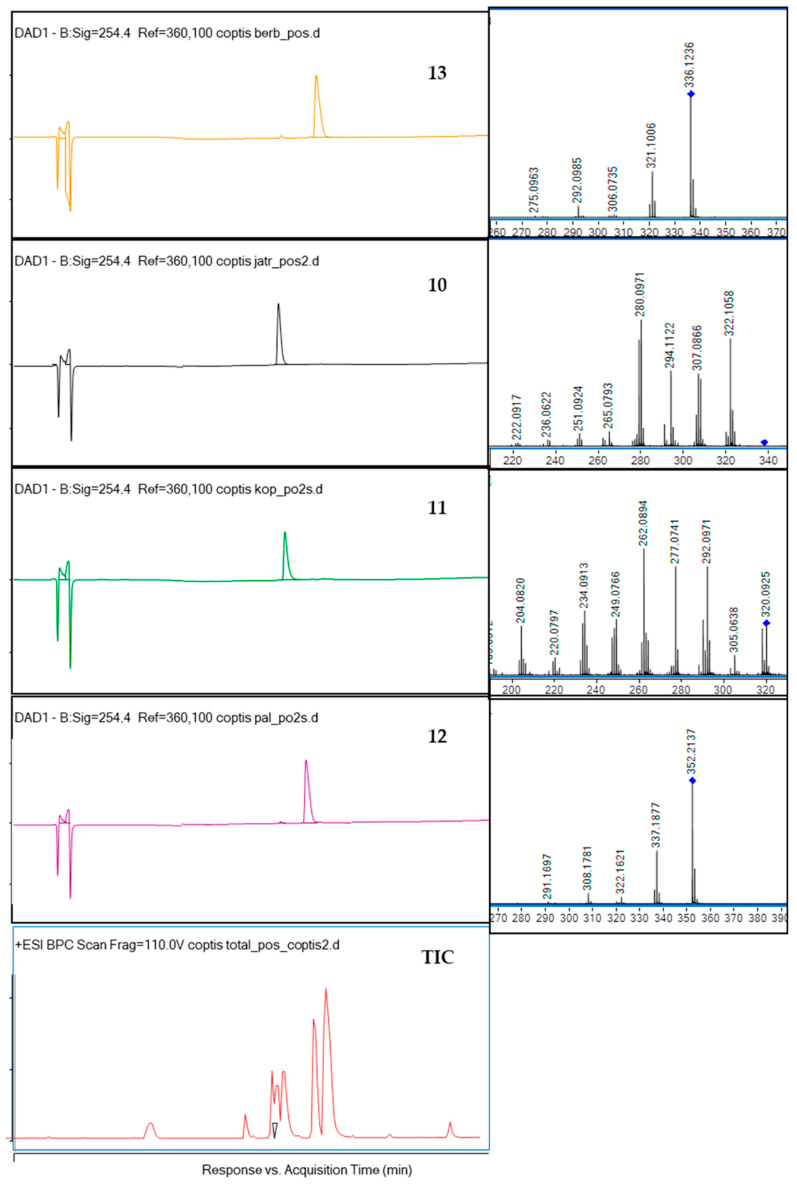
Fig. 2
The HPLC-DAD chromatograms of the isolated compounds 13, 10, 11, 12 and of the total ion chromatogram (TIC) at 254 nm together with their fragmentation spectra (on the right side) and the crude extract chromatogram.
Acknowledgments
This image is the copyrighted work of the attributed author or publisher, and
ZFIN has permission only to display this image to its users.
Additional permissions should be obtained from the applicable author or publisher of the image.
Full text @ Int. J. Mol. Sci.